Virginia Department of Education
Normal Distributions
Pupils work to find probabilities by using areas under the normal curve. Groups work to calculate z-scores and solve real-world problems using the empirical rule or tables.
Statistics Education Web
What Does the Normal Distribution Sound Like?
Groups collect data describing the number of times a bag of microwave popcorn pops at given intervals. Participants discover that the data fits a normal curve and answer questions based on the distribution of this data.
Radford University
Is Fall Normal?
Fine the normality of fall measurements. Pairs collect measurements of fall leaves and one other fall object. Using the measurements, the groups determine the descriptive statistics for the object and using the Empirical Rule, figure out...
US Department of Commerce
The New Normal
Don't be normal ... be exceptional in understanding statistics. Pupils analyze six different sets of census data using histograms or normal probability plots to determine whether each data set fits a normal distribution. They then get...
Curated OER
Puberty/Adolescence, Day 3: "Am I Normal?"
"Am I normal?" Bring this topical discussion to your health or teen issues class, who might be struggling with their developing identities. Learners discuss relationships, including acquaintences, friendships, girlfriends, boyfriends,...
CK-12 Foundation
Properties of a Normal Distribution: Uniform Distributions
There's nothing normal about an extraordinary resource. Scholars change the dimensions of a normal distribution using a slider interactive. Determining the area under the graph gives probabilities for different situations.
EngageNY
Normal Distributions (part 1)
Don't allow your pupils to become outliers! As learners examine normal distributions by calculating z-scores, they compare outcomes by analyzing the z-scores for each.
Shodor Education Foundation
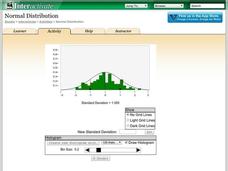
Normal Distribution
Does the size of the bin matter? The resource allows pupils to explore the relationship between the normal curve and histograms. Learners view histograms compared to a normal curve with a set standard deviation. Using the interactive,...
Howard Hughes Medical Institute
Sampling and Normal Distribution
Young scientists learn about sampling and normal distributions through data analysis. A worksheet guides them to better understanding and synthesis of knowledge.
Radford University
How Normal Are You?
It's completely normal to learn about normal distributions. An engaging lesson has young statisticians collect and analyze data about their classmates as well as players on the school's football team. They determine whether each set of...
CK-12 Foundation
Normal Approximation of the Binomials Distribution: When to Approximate
Normalizing a binomial distribution — determine when it is all right. Given the rule of thumb of when it is appropriate to use the normal distribution to approximate a binomial distribution, pupils look at different scenarios. Scholars...
Radford University
What Is Normal?
Are you taller than a Major League Baseball player? Future mathematicians learn about normal distributions, percentiles, z-scores, and areas under a normal curve. They use the concepts to analyze height data of Major League Baseball...
Radford University
Are We Normal?
Develop a sense of normal. Learners develop two questions to ask classmates to gather numerical data before creating a box and whisker plot and a histogram to display their data. Class members make inferences and investigate the data...
Radford University
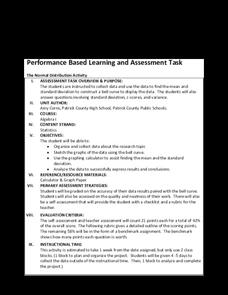
The Normal Distribution Activity
For whom does the bell fit? Pupils begin by working in groups gather data on three different variables. They then determine the mean and standard deviation of each data set and create bell curves. To finish, they answer guiding questions...
US Department of Commerce
Over the Hill - Aging on a Normal Curve
Nobody is too old to learn something new. Young statisticians analyze census data on the percentage of the population older than 65 years old in US counties. They fit a normal distribution to the data, determine the mean and standard...
Flipped Math
Unit 12 Review: Probability and Normal Distributions
It's time to assess probability knowledge. Individuals complete a set of problems to review concepts from the unit. They identify outcomes and sample spaces, determine compound and conditional probabilities, and investigate situations...
Curated OER
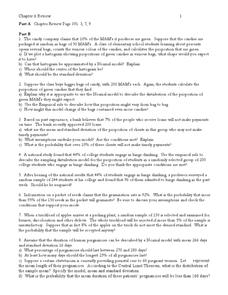
Random Probability
In this statistics and probability worksheet, young statisticians solve and complete 13 different problems related to probability, percentages, and normal distributions. They consider data models, assumptions about the models, and find...
CK-12 Foundation
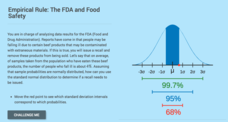
Computing Probabilities for the Standard Normal Distribution: The FDA and Food Safety
To recall or not to recall, that is the question. Using provided data, pupils calculate the percent of people that may fall ill on average. The scholars determine the standard deviation based upon the mean and the empirical rule, then...
Curated OER
Exploring the Normal Curve Family
Students find different characteristics of the bell curve. In this statistics lesson, students analyze a family for a specific characteristic. They identify the shape, center, spread and area as they analyze the characteristic of the...
Curated OER
Model of a Normal Fault
Students understand what a normal fault is and why it causes an Earthquake. In this normal fault instructional activity, students create a model of a normal fault.
Curated OER
The Need for Normality
Students investigate the need for measuring concentrations in normality in titrations. In this titrations and normality activity, students perform titrations and use different indicators to show they change colors at different pH values....
EngageNY
Using a Curve to Model a Data Distribution
Show scholars the importance of recognizing a normal curve within a set of data. Learners analyze normal curves and calculate mean and standard deviation.
Shodor Education Foundation
Skew Distribution
Slide the class into a skewed view. Learners alter the location of the median relative to the mean of a normal curve to create a skew distribution. They compare the curve to a histogram distribution with the same skewness.
101 Questions
Class Height Distribution
A picture is worth a thousand words, and this is no exception! The introductory photo shows a group of classmates lined up in height categories; females and males are in different colors, and the shape of the curve they create is...


