American Statistical Association
Scatter It! (Using Census Results to Help Predict Melissa’s Height)
Pupils use the provided census data to guess the future height of a child. They organize and plot the data, solve for the line of best fit, and determine the likely height and range for a specific age.
American Statistical Association
Scatter It! (Predict Billy’s Height)
How do doctors predict a child's future height? Scholars use one case study to determine the height of a child two years into the future. They graph the given data, determine the line of best fit, and use that to estimate the height in...
Curated OER
Inferring Height From Bone Length
Students determine the relationship between bone length and height. In groups, they are told the race and gender of the individual and discuss how this affects height. They measure the lengths of the bones in metric measurements and...
Curated OER
Orienteering - Lesson 4 - Distance and Height
Pretend that you've been dropped onto a mountain, in the middle of nowhere, and all you have to find your way is a topographical map and a compass. Could you find your way to the nearest town? Orienteering teaches the skills of map...
Curated OER
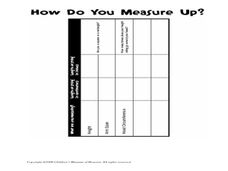
How Do You Measure Up?
Students measure their body. In this measurement lesson, students use a string to measure their height and the circumference of their head. They record this information on the worksheet provided and answer questions as a group.
Kenan Fellows
Man vs. Beast: Approximating Derivatives using Human and Animal Movement
What does dropping a ball look like as a graph? An engaging activity asks learners to record a video of dropping a ball and uploading the video to software for analysis. They compare the position of the ball to time and calculate the...
Curated OER
Volume of Rectangular Pyramid
In this volume worksheet, students determine the volume of a rectangular pyramid. They calculate the volume when given the length, width, and height. This two page worksheet contains eight multi-step problems. Answers are provided on the...
Curated OER
Stories from Africa
Learners discuss the size of adult African elephants after a demonstration on their height. They try to guess the animal of discussion based on clues given about their size and characteristics. As a class, they try to identify other...
Exploratorium
Handy Measuring Ratio
Your hand can be a handy tool for measurement. Young mathematicians learn how to estimate the height of objects by applying similarity. They find the horizontal distance from the object where spreading their outstretched fingers results...
Baylor College
Body Mass Index (BMI)
How do you calculate your Body Mass Index, and why is this information a valuable indicator of health? Class members discover not only what BMI is and practice calculating it using the height and weight of six fictitious individuals, but...
Curated OER
Scatter Plots
In this scatter plots worksheet, students solve and complete 6 different problems. First, they create a scatter plot to illustrate how weight and height are related and determine their relationship as positive, negative or no relation....
EngageNY
Definition and Properties of Volume
Lead a discussion on the similarities between the properties of area and the properties of volume. Using upper and lower approximations, pupils arrive at the formula for the volume of a general cylinder.
Curated OER
Height of Bounce
Eighth graders determine the relationship between the height of bounce of a ping-pong ball and the height from which it was dropped. They are assessed on the ability to record and interpret data, graph data, make predictions, and make...
Curated OER
Changing Ramp Heights
Students conduct an experiment to determine how the change in ramp height affects the distances a ball is able to move a stationary cup. Data is collected from several trials and recorded and analyzed.
Curated OER
Downtown landmarks: math facts
In this downtown landmarks worksheet, students look at the height in feet and dates built of different landmarks and answer math questions about them. Students complete one graph, one timeline, and 5 questions.
Illustrative Mathematics
Shrinking
Is Aunt Nancy shrinking? Find out by calculating with the average height women lose each year. The activity practices multiplying and dividing with decimals and rounding the final answer.
Curated OER
How Tall is that Tree?
Students use their feet to measure distance between themselves and a tree trunk. In this distance lesson, students use the number of steps, and string to measure distances and height of the tree. Students can get the tree height when...
American Statistical Association
You and Michael
Investigate the relationship between height and arm span. Young statisticians measure the heights and arm spans of each class member and create a scatter plot using the data. They draw a line of best fit and use its slope to explain the...
EngageNY
Proving the Area of a Disk
Using a similar process from the first lesson in the series of finding area approximations, a measurement resource develops the proof of the area of a circle. The problem set contains a derivation of the proof of the circumference formula.
DiscoverE
Touch Down
Protect the marshmallows! Groups create contraptions that will keep marshmallows in a cup, even after dropping them from a certain height. This is a fun way to model the shock-absorbing capabilities of spacecraft.
Inside Mathematics
Swimming Pool
Swimming is more fun with quantities. The short assessment task encompasses finding the volume of a trapezoidal prism using an understanding of quantities. Individuals make a connection to the rate of which the pool is filled with a...
Curated OER
Quantitative Data
In this quantitative data worksheet, pupils compute measures of central tendency, draw vertical line diagrams, and compare collected data. This 23-page worksheet contains approximately 100 multi-step problems. Explanations and examples...
Curated OER
Lesson #46: Bar Graphs and Line Graphs
In this bar graphs and line graphs instructional activity, students interpret bar graphs, line graphs, and box-and-whisker plots. They find the measures of central tendency. This three-page instructional activity contains notes,...
Curated OER
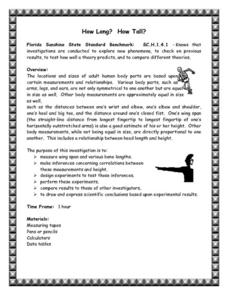
How Long? How Tall?
Seventh graders investigate the parts of the human body and examine the symmetry of body parts like arms and legs. They measure the body parts and take individual height and weight to compare the quantities. Student examine whether the...


