Curated OER
Building Brilliant Bar Graphs
Everything you need for a mini-unit on bar graphs is included in this lesson plan! It outlines three lessons and includes worksheets. Learners taste pretzels, shoot baskets (switching off hands), and grab candy, graphing results...
Scholastic
Study Jams! Bar Graphs
Mia teaches Sam how to create a bar graph, including forming a title, creating and labeling the axes, choosing a scale, and entering data. After viewing, data analysts can test themselves with seven follow-up questions and review...
K-5 Math Teaching Resources
Blank Bar Graph Template
This template is just begging for your young mathematicians to fill it in with colorful bar graphs! With horizontal and vertical axes in place and grid lines for added support, this is a great resource for teaching children how to...
Curated OER
Read My Bar Graph!
Elementary schoolers make and use bar graphs to picture information. They learn how choosing the right scale for a bar graph can help make a persuasive argument. This is a terrific lesson on graphing which should excite your kids. There...
Curated OER
Graphing the Forecast - Line Graph or Bar Graph?
Sixth graders compare and contrast bar and line graphs. Using a weather forecast of the area, 6th graders record the high and low temperatures in a table. Students determine and justify the most appropriate graph to display a given set...
Curated OER
Double Bar Graphs - Homework 7.1
Your learners have seen basic bar graphs, but do they have experience reading double bar graphs? This worksheet details how to draw a double bar graph and provides an example with six accompanying questions. The final question asks...
Fun Music Company
Writing Major Scales
Designed as an assessment of understanding, this one-page worksheet asks musicians to demonstrate their understanding of scales by drawing C, G, and F Major scales on the provided staffs.
Magic of Physics
Scale of the Universe I
From quantum foam to the universe itself, plus everything in between, what is the scale of the world around us? Inquisitive physicists grapple with the proportions of all things great and small using a fascinating interactive. Scholars...
Education Development Center
Word Problem with Rational Numbers—Balancing Bars of Soap
Here's a resource teachers won't want to wash their hands of. Given a task where a full bar of soap is on one side of a balance and 3/4 of a bar of soup and a 3/4-ounce weight is on the other side, young mathematicians must determine the...
Curated OER
Raising the Bar While Hogging the Ham (Radio, That Is)
Young scholars watch a Cyberchase video to determine the importance of using the correct scale when making bar graphs. They examine how to use bar graphs to gain information easily. They determine how to use bar graphs persuasively.
Curated OER
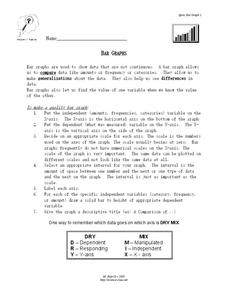
Bar Graphs
In this bar graph worksheet, students read about making quality bar graphs and they make a bar graph using given data. They answer 5 questions about their graph.
Curated OER
Olympic Bar Graphs
In this Olympic bar graph worksheet, students pick a sport from the 2004 Olympic games and find data from the Olympic web page. They graph the scores (times, distance, or speed) and the medals. They answer questions about the variables...
Curated OER
Graphing the Forecast-Line Graph or Bar Graph?
Students explore bar and line graphs. In this data collection, graphing, and weather instructional activity, students compare bar and line graphs and discuss which type of graph would be most appropriate for displaying a ten day weather...
Curated OER
Integrated Algebra Practice: Frequency Histograms, Bar Graphs and Tables
In this graphs activity, students solve 4 problems about histograms, bar graphs, and tables. Students answer questions about histograms, bar graphs, and tables.
Curated OER
Cutting Expenses
Students explore budgeting. In this finance and math lesson, students brainstorm ways in which households could save money. Students view websites that give cost reducing ideas. Students complete an expense comparison chart and use the...
Curated OER
Sand Babies
An engaging lesson which has elementary learners measure weight to the nearest pound and construct and interpret a bar graph! They measure length using non-standard units and determine area using square tiles. Pupils round their birth...
Curated OER
Paying Attention to Scale
Students create bar graphs. In this graphing lesson, students watch video clips about bar graphs and complete worksheets. The focus of this lesson is on creating the correct scale for the bar graph and correctly labeling the axes.
Center for Math and Science Education
Solar System Launch
Trying to understand the vastness of outer space can be quite a challenge for young scientists. Help put things in perspective with this cross-curricular activity as students work in pairs creating scaled models of the solar system,...
Alabama Learning Exchange
What's Your Favorite Chocolate Bar?
Students complete a math survey. In this math graphs lesson, students complete a survey about their favorite candy bars. Students create different kinds of graphs using Microsoft Excel to show their results.
Curated OER
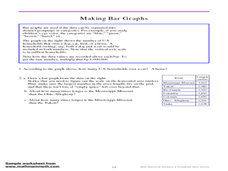
Making Bar Graphs
In this bar graph worksheet, students answer short answer questions about bar graphs. Students answer 1 question about a bar graph about a cat, and 3 questions about a bar graph about U.S. rivers.
Curated OER
Making a Bar Graph
In this bar graph worksheet, students analyze a data table and bar graph depicting information about stickers collected. Students answer 5 questions about the data displayed.
Curated OER
Simple Bar Graphs Using Excel
Students create original survey questions, and develop a bar graph of the data on paper. They input the survey data using two variables onto an Excel bar graph spreadsheet.
Curated OER
Tracing Highs and Lows in San Francisco
On a topographic map, high schoolers identify the scale bar, north arrow, and contour interval. They then locate a hill on the map and make note of the contour lines. Students then locate other places with similar contour line patterns....
Curated OER
Survey Says...
Young learners create and implement a school-wide survey about student body favorites! Learners record and analyze the data on a bar graph, picture graph, and line graph, and then display the data. Then, wrap it all up with a celebration...


