Curated OER
Addition Number Chart
Number charts are a great way for learners to practice counting and observe number patterns. There are four charts here with missing numbers for scholars to fill out. Each contains some numbers filled in as reference. Challenge...
Student Handouts
Beginning-Middle-End Chart
Track the plot of a book with a straightforward chart. Pupils write in the title of the book and then note down what happened at the beginning, middle, and end of the story.
Curated OER
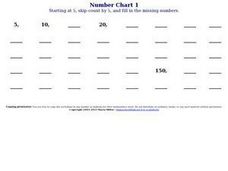
Number Chart 12: Skip Counting by 5
In this skip counting worksheet, students fill in the numbers to complete a pattern of skip counting by 5. Students begin with the number 5 and write the numbers as they skip count to 200.
Curated OER
Counting in Decimals
Learners use a complete decimal number chart starting with 0.01 and ending with 1.0. They then fill in missing decimals in a second chart and check their answers using chart 3. This idea is wonderful for getting kids to think about...
Curated OER
Reading Tally Chart
As learners explore data analysis have them practice reading tally charts using these examples. They answer basic questions about each of three charts, employing addition and subtraction skills. For example, a chart tallying t-shirts...
Curated OER
Verb Conjugation Chart
Spanish language learners practice conjugating a series of common verbs: ver, vivir, beber, comer, escribir, and leer. Using the chart, you could easily assess your learners and their current ability to recall conjugations. After they...
EngageNY
Forming a Research-Based Claim: Stakeholder Chart on Better Industrial Water Management
It's time to stake a claim! Working with partners, scholars create stakeholder charts for better industrial management of water. As they complete the chart, pupils consider an option for managing water more sustainably, identify...
Curated OER
Complete the Square: Increments of 10
In this counting by ten activity, students complete a chart by filling in the missing numbers from 0 to 1000. All numbers will be multiples of ten.
EngageNY
Determining Cascading Consequences Using The Omnivore’s Dilemma: Industrial Food Chain
Which of Michael Pollan's four food chains from his book The Omnivore's Dilemma would best feed everyone in the United States? Using a thought-provoking resource, scholars learn how to create a Cascading Consequences chart to answer the...
Curated OER
Number Chart 1
In this number sense worksheet, students start at 0 and fill in the missing numbers in a hundreds chart. They complete a fill in the blank version as opposed to a grid type.
Curated OER
Place Value and Decimal Chart
In this place value and decimal worksheet, students solve and complete 1 chart that includes various place values and decimals. They use the chart given on the sheet to assist them in reading and writing various given decimal numbers.
Curated OER
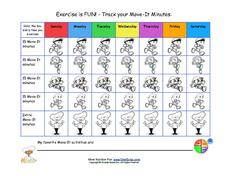
Exercise is Fun! - Track Your Move-It Minutes
Get your class up and moving with a fun exercise tracking chart. Kids will be able to see just how much exercise they get in a single week as they color in the grid to indicate how much they moved each day. The grid provides five boxes...
Miami-Dade County Public Schools
Conventions Chart
Help your young writers pay close attention to their conventions and move toward revision with a straightforward chart. Learners can analyze 11 sentences on this page by noting down the first letter in each, the first of words in each,...
Do2Learn
Desk Chart
Did Sally Student raise her hand to speak? Walk quietly into the room? Share her work with a partner? Great! Reinforce positive behaviors with an individualized chart. Once a learner completes a certain action three times, he or she gets...
K12 Reader
Narrator’s Point of View Flow Chart
How can you tell what point of view a narrator is using, and why does it matter when reading or writing? Use a handy flow chart to determine whether or not your narrator is telling the story from a first or third person point of view.
Curated OER
Number Chart 1-100
In this counting worksheet, students complete a number chart. Students fill in the missing numbers from one through one hundred.
Curated OER
Counting to 100 (by 1s)
This hundreds chart is missing some numbers! Your scholars fill them in (92 are missing), and then they challenge themselves with a chart that looks a bit different. Using the same 10 x 10 layout, the second chart is filled with letters,...
EngageNY
Reading for Gist: “Middle Ages” Excerpt 2
Read and repeat. Scholars repeat the strategies for digging deeper into text from lesson two. This time they focus on Middle Ages Excerpt 2. Learners write unfamiliar words in the word catcher and use details from the text to add to the...
EngageNY
Analyzing Images and Language: Inferring about the Natural Disaster in Eight Days
Pictures often reveal different meanings. Scholars analyze the images in Eight Days and discuss how they add meaning to the text. Readers answers questions about how specific colors are used to create different emotions. Learners then...
Curated OER
Possessive Adjectives
You could use this resource with your young native English speakers or your English language learners. They practice using possessive adjectives like my, your, his, her, its, our, and their. First they study a chart that compares...
Columbus City Schools
Photosynthesis and Respiration
Thirty percent of the world's oxygen is produced by rainforests found throughout the world. Seventh grade learners explore the processes of photosynthesis and respiration through 10 days of labs, manipulatives, and discussions. They...
Curated OER
A Proportional Fish Story
In this proportions worksheet, students identify and complete 8 different problems that include using proportions to build scale models of various animals. First, they use the scale to complete the chart and draw lines representing the...
Curated OER
"No News Like Ancient News"
Want to know more about Ancient history? Young historians will read a minimum of two web sites to complete the chart "Residents of Olympus". They choose one Greek god or goddess to research. This could be a small group activity or...
EngageNY
Interpreting and Connecting Information: Creating a Cascading Consequence Chart Using Frightful’s Mountain
Decisions, decisions. Scholars take a close look at making decisions by discussing the character Sam in chapters one through eight of Frightful’s Mountain. Partners discuss whether Sam should interact with Frightful and then complete a...


