Inside Mathematics
Graphs (2006)
When told to describe a line, do your pupils list its color, length, and which side is high or low? Use a activity that engages scholars to properly label line graphs. It then requests two applied reasoning answers.
Curated OER
Graphs of Functions
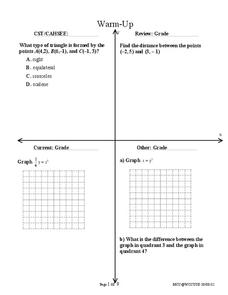
Learners explore the concept of quadratic equations. In this quadratic equations worksheet, students are given the parent graph y=x^2 and must determine the equations of two quadratic equations that have been shifted.
CK-12 Foundation
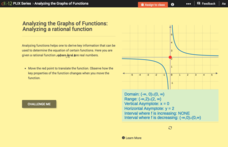
Analyzing the Graphs of Functions: Analyzing a Rational Function
Shift the function and transform the key features of the graph. By translating the graph of the rational function, class members find out how the key features alter. Pupils determine the domain, range, asymptotes, and intervals of...
CK-12 Foundation
Horizontal Translations or Phase Shifts: Cosine
If cosine is shifted, how is its equation affected? Learners manipulate the graph of cosine by moving the y-intercept to different locations on the coordinate plane. Pupils determine the new equation that models the shifts.
CK-12 Foundation
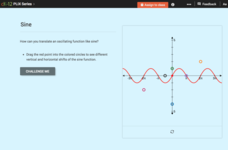
Horizontal Translations or Phase Shifts: Sine
Shift a trigonometric function and find its new equation. Pupils translate a sine function on a graph. The scholars determine the equation of the function that represents the translated graph and observe the connection between a...
Inside Mathematics
Graphs (2007)
Challenge the class to utilize their knowledge of linear and quadratic functions to determine the intersection of the parent quadratic graph and linear proportional graphs. Using the pattern for the solutions, individuals develop a...
Texas Instruments
Graphs of Rational Functions
Take your kids on a tour of graphing rational functions. Using this TI lesson, high schoolers identify the end behavior of their functions. They find the domain and range, describe end behavior, and look at asymptotes and restrictions of...
West Contra Costa Unified School District
Shifting Linear Equations in Function Notation
Time for a shift in thinking! Learners examine translations of linear functions. They use function notation to describe the translation and make connections to the graph.
Virginia Department of Education
Transformational Graphing
Find relationships between the structure of a function and its graph. An engaging lesson explores seven parent functions and their graphs. Learners match functions to their graphs and describe transformations.
Curated OER
Supply Curves, Moves Along Supply Curves, and Shifts in Supply Curves
Have your class explore the topic of supply and demand using this resource. Learners read background information, plot information on a graph, solve problems, and answer questions about this topic.
CK-12 Foundation
Horizontal Translations or Phase Shifts: Horizontal and Vertical Translations
It is all about the shift. Pupils translate the graph of a cubic function to different marked locations on the plane and determine the new equation that represents the shifts. The activity is designed to encourage individuals begin to...
CK-12 Foundation
Horizontal Translations or Phase Shifts: Tangent
Patterns can be shifty! Find the pattern when shifting the graph of tangent. Pupils move the graph of tangent to different locations on the coordinate plane. They observe what happens to the function and its vertical asymptotes before...
CK-12 Foundation
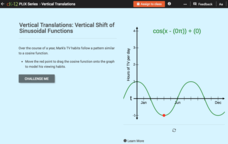
Vertical Translations: Vertical Shift of Sinusoidal Functions
Create a shift in TV viewing habits. The interactive presents a cosine model of an individual's TV viewing habits during a year. Class members move the model to reflect given conditions. Finally, they determine key features from the...
Alabama Learning Exchange
Technology for Displaying Trigonometric Graph Behavior: Sine and Cosine
Students explore the concept of sine and cosine. In this sine and cosine lesson, students work in groups to graph sine and cosine functions. Students examine how coefficients in various parts of each parent function shift the graph. ...
Curated OER
Making a Circle Graph of a Sample Budget
Students examine a sample budget and categorize the entries as a group. Then in small groups they convert budget category totals to percents and degrees to make a circle graph related to a sample budget.
Yummy Math
Playing with my calculator on the 4th of July
This fun activity guides learners through an exploration of the effects of replacing f(x) with -f(x), f(x) + c, k f(x), and f(x + c). Using graphing calculators, students experiment with variations of the graph of y = x^2 to design a...
CK-12 Foundation
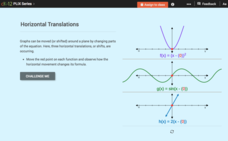
Horizontal Translations or Phase Shifts: Horizontal Translations
Find out what causes a function to slide. Pupils move a function along the x-axis and see the resulting change in its equation. Scholars determine the effects that the translation has on the intercepts, domain, and range of the function.
Curated OER
IB Math SL 1 - Transformations and Combinations Worksheet
Study transformations and combinations with your advanced math class. They solve four graphing problems by graphing the transformations of a parent graph. They determine the equations to represent the given transformations of a parent...
Curated OER
Point-Slope Form of a Line
This activity helps young mathematicians connect the graph and the point-slope form of a line, by first solving a real-world problem and then using that example to motivate the understanding of the equation. By manipulating the gizmo,...
McGraw Hill
Doppler Shift Interactive
Ever wonder why a siren sounds different when it's coming toward you than when it's going away from you? It all depends on the motion of the sound waves! The interactive activity demonstrates how the Doppler effect impacts the motion of...
West Contra Costa Unified School District
Conics Introduction and Parabolas
Where did conic sections get their name? The equation and graph of a parabola are developed from the definition of the conic section. Teacher examples on graphing the equation and writing an equation from the graph round out the plan.
Inside Mathematics
Sorting Functions
Graph A goes with equation C, but table B. The short assessment task requires class members to match graphs with their corresponding tables, equations, and verbalized rules. Pupils then provide explanations on the process they used to...
Noyce Foundation
Granny’s Balloon Trip
Take flight with a fun activity focused on graphing data on a coordinate plane. As learners study the data for Granny's hot-air balloon trip, including the time of day and the distance of the balloon from the ground, they practice...
Inside Mathematics
Squares and Circles
It's all about lines when going around. Pupils graph the relationship between the length of a side of a square and its perimeter. Class members explain the origin in context of the side length and perimeter. They compare the graph to the...


