University of Nottingham
Drawing to Scale: A Garden
See how design and geometry go hand in hand. The activity asks learners to use geometry to design a backyard garden given dimensions of each feature. Scholars work with ratios and scale to develop an accurate scale drawing that includes...
Flipped Math
Unit 1 Review: Analyze Graphs and Expressions
Get in one last practice. Pupils work through 12 problems and a performance task to review the topics in Unit 1. The problems cover analyzing and modeling with graphs, algebraic properties of equality, and adding, subtracting, and...
Curated OER
Environmental Agents of Mathematics: Mathematics for Change
High schoolers analyze environmental science data using Math. They do research about renewable energy, gather data, create graphs and interpret their findings. Then the group presents their arguments persuasively using their findings to...
Curated OER
The Power of Graphical Display: How to Use Graphs to Justify a Position, Prove a Point, or Mislead the Viewer
Analyze different types of graphs with learners. They conduct a survey and determine the mean, median and mode. They then identify different techniques for collecting data.
Curated OER
Exploring Similarity Using Scale Drawings
Learners explore scale factor as they create a scale drawing of a box, then determine the surface area and volume of the original and the scale drawing. The one page worksheet contains activities and procedures with four questions.
Curated OER
Cutting Expenses
Students explore budgeting. In this finance and math lesson, students brainstorm ways in which households could save money. Students view websites that give cost reducing ideas. Students complete an expense comparison chart and use the...
Illustrative Mathematics
Peaches and Plums
According to the resource graph, which costs more: peaches or plums? Algebra learners compare two proportional relationships and then throw in a banana. Leaving out the scale helps students become intuitive about graphing.
Achieve
Yogurt Packaging
Food companies understand how to use math to their advantage. Learners explore the math related to the packaging and serving size of yogurt. They then use unit analysis and percent values to make decisions on the product development.
National History Day
Why Did the United States Enter World War I in 1917?
World War I was the first major conflict on a global scale. Using primary documents, learners determine why the United States chose to enter World War I when it did. After analytical writing and group research, the causes of America's...
Teach Engineering
Measuring Viscosity
Groups use a marble to determine the viscosity of household fluids. The procedure calls for pupils to measure the amount of time it takes a marble to fall a specified distance in the fluids. Using unit conversions and algebra, the teams...
Curated OER
A Look at the Population Density of the United States
Students acquire census information and create maps of the population density of the United States on different scales. They role play the roles of workers of a retail company and they use the population data to market to their customers.
Curated OER
Tracing Highs and Lows in San Francisco
On a topographic map, high schoolers identify the scale bar, north arrow, and contour interval. They then locate a hill on the map and make note of the contour lines. Students then locate other places with similar contour line patterns....
Curated OER
Orienteering - Lesson 2 - Topographical Maps
One of the most important skills in orienteering is being able to read a topographical map. Understanding the contour lines and symbols and the scale of the map will make planning your route so much better. In this lesson, partners get...
BW Walch
Creating and Graphing Linear Equations in Two Variables
This detailed presentation starts with a review of using key components to graph a line. It then quickly moves into new territory of taking these important parts and teasing them out of a word problem. Special care is taken to discuss...
Curated OER
Scale Matters
Third graders study the meaning of the digits an any whole numbers with up to 3 decimal places. They order decimals with up to 3 decimal places and perform measuring tasks, using a range of units and scales.
Curated OER
Variables and Patterns: Determining an appropriate scale while graphing
Sixth graders determine appropriate scales when graphing data. In this graphing lesson, 6th graders use an the applet "Graph It" to determine what is an appropriate scale for their data.
Curated OER
Graphics Creation and Statistical Interpretation: Relating Local Economics and the Global Environment
Students apply statistics, and graphical interpretation to economics, the environment and populations. In this statistical lesson students construct graphical displays and classify data.
Achieve
Dairy Barn
Agriculture is truly a math-based profession! Help the dairy farmer determine the supplies needed to complete his barn. Using given dimensions, learners build equations and use units to determine the correct amount of materials.
Curated OER
Measuring Up
Students examine and discuss a variety of ways to measure length, capacity, and weight. They estimate and measure a pencil's length using Unifix cubes, estimate and fill a measuring cup with Unifix cubes, and weigh a calculator in a...
Achieve
Corn and Oats
How much land does a parcel hold? How much fertilizer does it take for a field of corn? Pupils answer these questions and more as they apply ratio reasoning and unit analysis.
Achieve
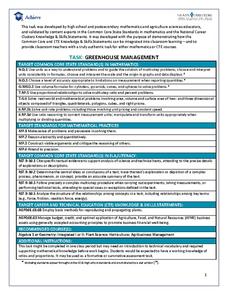
Greenhouse Management
Who knew running a greenhouse required so much math? Amaze future mathematicians and farmers with the amount of unit conversions, ratio and proportional reasoning, and geometric applications involved by having them complete the...
Curated OER
Dental Impressions
What an impressive task it is to make dental impressions! Pupils learn how dentists use proportional reasoning, unit conversions, and systems of equations to estimate the materials needed to make stone models of dental impressions....
Curated OER
Earthquakes: Fifth Grade Lesson Plans and Activities
After learning about P waves and S waves, fifth graders view the intensity of earthquakes by examining seismographs and images of earthquake damage. Young scientists then forecasting future quakes by analyzing data about earthquakes...
Prince William Network
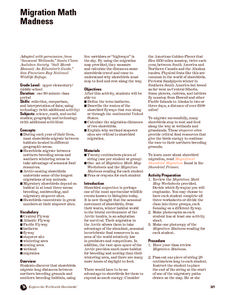
Migration Math Madness
A great way to incorporate math into life science, this lesson has learners measure migratory routes on a map and calculate the actual distance that shorebirds on the routes would cover. Learners compute the distance covered in both...


