San José State University
Organizational Patterns for the Comparison/Contrast Essay
Organization is key in essay writing. The two organizational charts included in this resource model the block approach and the point-by-point approach to organizing a compare and contrast style essay. After examining the charts, writers...
Texas Education Agency (TEA)
Business Operations and Organizational Structures
Costco, Google, and Microsoft are among America's largest employers. Using the resource, scholars learn what makes business like these successful. They write a mission statement for a chosen business, practice drawing organizational...
Curated OER
What is the Best Chip?
Scholars collect data about chips. They pick their favorite type of chip from a given variety such as potato chips, tortilla, or banana chips. Then they write on an index card their favorite chip and why it's their favorite. They also...
Curated OER
Logs, Charts, and Journals: What's On Your Plate?
Have your writers identify and use words that appeal to the senses. They create a chart of sensory words and record some of their favorites, then write a journal entry in which they describe eating at a restaurant using sensory details....
Curated OER
Organizing by Writing
Middle schoolers analyze how to use writing for generating and organizing their thoughts before communicating them. They use the questions on the first handout to organize a three-minute introduction of themselves to their small group....
Curated OER
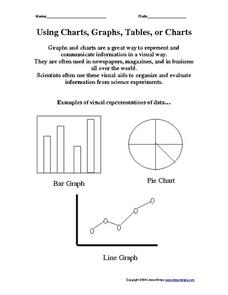
Using Charts, Graphs, Tables, or Charts
In this charts, graphs and tables worksheet, students view 3 different types of visual representations of data, make a list of 20 items and decide how the items can best be put together in groups to make a graph, chart or table. Students...
Curated OER
Organizing and Interpreting Data
In this organizing and interpreting data worksheet, students solve and complete 10 different problems related to reading various data tables. First, they complete the 3 charts shown with the correct tally amount, frequency amount, and...
Museum of Tolerance
Why is This True?
Are wages based on race? On gender? Class members research wages for workers according to race and gender, create graphs and charts of their data, and compute differences by percentages. They then share their findings with adults and...
Curated OER
Pie Graph
Fifth graders examine fractional parts of pie graphs. Given a bag of M&Ms, 5th graders interpret the data. They use a paper plate and colors to create a graph of the types of M&Ms represented.
Raytheon
Data Analysis and Interpretation
For this data analysis and interpretation worksheet, learners use charts, graphs, statistics to solve 42 pages of problems with answer key included.
Curated OER
Data Handling
In this data handling worksheet, students interpret data found in table, graphs and charts. They organize data and draw bar charts. This two-page worksheet contains 2 multi-step problems.
Curated OER
The Stamp Act Effect
Sixth graders examine the Stamp Act. In this Stamp Act lesson, 6th graders analyze documents surrounding the Stamp Act. Students determine the reasons, oppositions and impacts of the Stamp Act and organize this information on a chart....
Math Moves U
Collecting and Working with Data
Add to your collection of math resources with this extensive series of data analysis worksheets. Whether your teaching how to use frequency tables and tally charts to collect and organize data, or introducing young mathematicians to pie...
Curated OER
How To Write a Social Studies Outline
One of the keys to success in school is organization. This resource leads learners through the process of creating an outline for a chapter from a social studies text. In addition, they review facts they have learned in their class...
Curated OER
Reading Bar Charts
Help kids understand how to collect data through surveys, organize data in a bar chart, then analyze their findings. There are three different surveys for learners to conduct, a full description of all the parts of a bar chart, and three...
Curated OER
Organizing Data
In this organizing data instructional activity, 7th graders solve seven different types of problems related to data. They first identify the type of data as categorical, discrete or continuous from the information given. Then, students...
Curated OER
Charts and Graphs
Fifth graders interpret data into graphs and percentages. In this organizing data lesson plan, 5th graders discuss bar, circle and line graphs. Students complete bar graph and apply probability using the results.
Scholastic
Spin-a-Story: Writing Prompts Chart
"But I don't know what to write about!" Now, there's a very familiar complaint. And here's a very creative solution. Young authors are given a writing prompt chart, spin three wheels that provide suggestions for the who, what, and where...
Curated OER
Physical Science: Festival of Bubbles
Investigate bubbles through the use of scientific inquiry. Pupils blow bubbles using several methods and measure the resulting bubble print. Measurements are recorded on a data table and transferred to a bar graph. Results are discussed...
Curated OER
Special Ed. Resource
Ways to organize data is the focus of this math PowerPoint. Students view slides that define and give descriptions of a variety of graphs, and how mean, median, and mode are found. A good visual tool which should benefit almost all types...
Curated OER
Can You Count on Cans?
How can a canned food drive be connected to math? It's as simple as counting and organizing the cans! Children demonstrate their ability to sort non-perishable foods into categories that include soup cans, vegetable cans, boxed items,...
Curated OER
Data Analysis: For Little Learners
Using pictographs, tally charts, and surveys, kids learn all about data analysis and collection. They make surveys, collect data, then construct pictographs and tally charts to organize their information.
University of North Carolina
Comparing and Contrasting
Not all compare and contrast assignments have writers compare and contrast in the same way. Some only ask for comparisons, others only ask for contrasts, and many require more focus than a simple list of similarities and differences....
Curated OER
Graphing Fun In Third Grade
Third graders display information in a graph, table, and chart. In this data lesson plan, 3rd graders look at graphs, tables, and charts, discuss their importance, and make their own.


