Illustrative Mathematics
Rainfall
Find the how long it has been raining based upon the amount of rainfall. Scholars analyze a table of the amount of rainfall as a function of time. Pupils first determine whether the function is invertible, then they find and interpret...
Curated OER
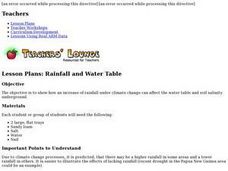
Rainfall and Water Table
Through inquiry, experimentation, and observation, young scientists see how an increase in rainfall under climate change can affect the water table and soil salinity underground. Young scientists build models that represent the...
Curated OER
Fun With Rainfall Measurements
Demonstrate how rain is measured. Pupils will use a rain gauge to measure the amount of rainfall during one week. Then record the data and discuss the results.
Curated OER
Rainfall Mapping
Students explore rainfall and habitats. In this rainfall instructional activity, students explore the relationships among rainfall, vegetation, and animal habitats. Resources are provided.
National Wildlife Federation
When It Rains It Pours More Drought and More Heavy Rainfall
Which is worse — drought or flooding? Neither is helpful to the environment, and both are increasing due to climate change. The 16th lesson in a series of 21 covers the average precipitation trends for two different climates within the...
Illustrative Mathematics
Rainfall
Ideal for use as an introduction to the idea of inverse functions, this activity investigates rainfall as a function of time. Learners use the data displayed in a table of values to analyze the function and its inverse, including why the...
Curated OER
Fourth Grade Science
In this science worksheet, 4th graders answer multiple choice questions about natural objects, rainfall, the solar system, and more. Students complete 25 questions.
Curated OER
Comparing Amount of Rainfall in Different Geographical Areas
Third graders create rain gauges and take them home. Individually, they record the rainfall amounts at all of their homes over a 2-week period and then bring the data back to class so they can compare the different amounts of rainfall...
Curated OER
Precipitation in Michigan Cities
Third graders investigate the rainfall amounts in four Michigan cities to observe how cities near lakes are affected differently by precipitation than those that are inland. They record the rainfall for the cities over an eight day...
Curated OER
Measuring Rainfall Activity Page
In this measurement worksheet, 4th graders measure the amount of rainfall that is shown in each of 5 cylindrical containers using either inches or centimeters. They color the rainfall amount blue.
Curated OER
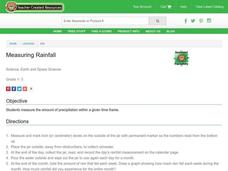
Measuring Rainfall
Students experiment to find out how rain is measured. In this rainfall measurement lesson, students experiment to observe the effects of rainfall and how much of it fell.
Curated OER
That Is a Lot of Rain
Students investigate the amount of rainfall in Manu, Peru. They view and discuss a video and fill a rain guage with the amount of rainfall in Manu. They research and compare local rainfall amounts to those of Manu, and write about what...
Curated OER
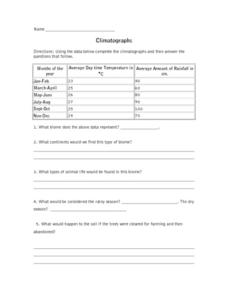
Climatographs
In this climatographs worksheet, students are given 3 sets of data of the rainfall and temperature for 3 different biomes. Students identify the types of biome for each and answer questions about each. They make 2 graphs to compare the...
Curated OER
Weather
Students create a spreadsheet and chart using data collected. In this weather lesson, students select five cities from their state, including the city they live in. Students take daily temperature readings from all five cities. ...
Curated OER
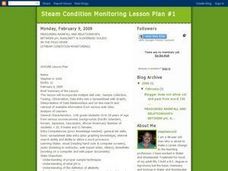
Measuring Rainfall and Relationships Between pH, Alkalinity and Suspended Solids in the Pago River
Eleventh graders test the pH and alkalinity of Pago River. In this ecology lesson, 11th graders collect data and use spreadsheet to graph results. They analyze and share their findings with the class.
Techbridge Curriculum
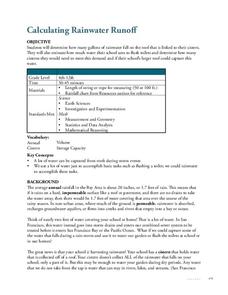
Calculating Rainwater Runoff
Thirsty plants soak up every bit of a rainfall, but what happens to the rain that hits the roof? Calculate the amount of rainwater from your school's roof with an Earth science activity, which brings measurement skills, observation...
California Academy of Science
California's Climate
The United States is a large country with many different climates. Graph and analyze temperature and rainfall data for Sacramento and Washington DC as you teach your class about the characteristics of Mediterranean climates. Discuss the...
Curated OER
Rainfall Measurement
Students are introduced to rainfall measurement and develop a network of rain gauges. Students measure rainfall, plot rainfall maps and calculate total rainfall volumes during rainstorms.
Curated OER
Hot and Humid, That's Manu
Elementary and middle schoolers participate in a demonstration of the heat and humidity of the Manu rainforest environment. They watch and discuss a video, calculate the humidity and temperature in the humidified tent, and write a...
Curated OER
Measuring Rainfall
Students investigate the amount of rain that falls in their area through the construction and monitoring of a rain gauge. The gauge is observed for one week, recordings are made, and observations described in a chart.
Curated OER
El Nino and Rainfall
Learners examine the relationship between El Nino and rainfall. They view an animation that simulates the various ocean currents, and analyze data from rainfall tables.
Curated OER
Does cloud type affect rainfall?
Student use MY NASA DATA to obtain precipitation and cloud type data. They create graphs of data within MY NASA DATA. Learners compare different cloud types, compare precipitation, and cloud type data They qualitatively describe graphs...
Curated OER
The Water Cycle: The Water Process
Its time to introduce the water cycle! This presentation describes the water cycle in terms of condensation, evaporation, and precipitation. Five straightforward comprehension questions and easy to understand concept definitions make for...
Education Outside
Rain Dance
The importance of rainfall to the life cycle is underscored by an activity that engages class members in a discussion of how water effects newly planted seeds and supports their growth. Class members then create a dance to celebrate the...
Other popular searches
- Types of Rainfall
- Measuring Rainfall
- Geography Rainfall
- Graphs + Rainfall
- Relief Rainfall
- Rainfall Types
- Rainfall Predictions
- Rainfall Measurement
- United States Rainfall
- Rainfall Map Lesson Plans
- Graphs Rainfall
- Rainfall and Texas


