Curated OER
Scatterplots and Regressions
In this scatterplots and regressions worksheet, students solve 6 different types of problems related to graphing scatterplots and interpreting regressions. First, they create a scatterplot from the given data coordinates and then,...
Curated OER
Scatterplots
In this scatterplots worksheet, students look at 4 graphs and determine the correlation between the data. Students then review 8 scenarios and decided the type of correlation.
Curated OER
Graphing Scatterplots
Students examine scatterplots and determine the equation of a line using the slope-intercept method. Students interpret graphs, draw inferences, and sketch a curve of best fit for the graph. Based upon patterns in the graphs, students...
Curated OER
Scatterplots
In this scatterplots worksheet, students construct a scatter plot from a given data set. Students then answer 4 questions regarding the least-squares regression line and making predictions.
Curated OER
Shake It Up with Scatterplots
Students identify how to use a scatterplot to compare two sets of data to determine if they are related. Then they identify and describe the definition of regression line (the "line of best fit"). Students also identify how scientists...
Curated OER
Scatterplots
Students evaluate equations and identify graphs. In this statistics lesson, students identify plotted points on a coordinate plane as having a positive, negative or no correlation. They complete basic surveys, plot their results and...
Virginia Department of Education
Scatterplots
Math is all fun and games with this activity! Learners use an activity designed around hula hoops to collect data. They create scatter plots with their data and then analyze the graphs for correlation.
Willow Tree
Scatterplots and Stem-and-Leaf Plots
Is there a correlation between the number of cats you own and your age? Use a scatter plot to analyze these correlation questions. Learners plot data and look for positive, negative, or no correlation, then create stem-and-leaf plots to...
Curated OER
Scatterplots
In this scatterplots worksheet, 9th graders solve 18 different types of problems related to scatterplots. First, they represent a two numerical variable on a scatterplot and describe how the data points are distributed. Then, students...
Curated OER
Scatterplots
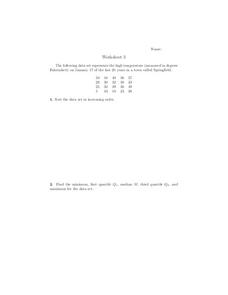
For this scatterplots worksheet, 9th graders solve and complete 6 different word problems with different sets of data. First, they sort the data set in increasing order and find the minimum, first quartile, median, third quartile, and...
Mathalicious
On Your Mark
With many factors leading to a great athlete, does height make Usain Bolt unfairly fast? Middle schoolers conduct analysis to change the running distance of the Olympic races to be proportional to the height of the participants. They...
Curated OER
What Can Scatterplots Tell Us?
Eighth graders use data from surveys conducted with parents, peers and themselves to create computer-generated scatterplots. They make inferences from their scatterplots.
Curated OER
Scatterplots
In this statistics worksheet, students create a scatter plot based on their analysis of data provided form the space shuttle Challenger disaster. The five page worksheet contains four questions. Answers are not provided.
Willow Tree
Approximating a Line of Best Fit
You may be able to see patterns visually, but mathematics quantifies them. Here learners find correlation in scatterplots and write equations to represent that relationship. They fit a line to the data, find two points on the line, and...
Kenan Fellows
Least Squares Linear Regression in R
The task? Determine the how effective hospitals are at reducing the rate of hospital-acquired infections. The method? Data analysis! Using an open source software program, individuals use provided data and create scatterplots to look for...
College Board
AP® Psychology: Teaching Statistics and Research Methodology
Psychologists use statistics? Scholars investigate the research behind the methodology of statistical analysis. Using hands-on practice, case-studies, and scatterplots, they complete various tasks to understand the very roots of high...
Curated OER
Scatter Plot Basketball
Learners take turns shooting baskets and creating scatterplots based on the data. They create two graphs and look for possible correlation in the data for each graph.
Curated OER
Data Analysis: Graphs, Charts, Tables, Statistics
In this data analysis worksheet, learners interpret data in 5 problems involving graphs, tables, and scatterplots. Students construct 1 stem and leaf plot and find the mean, median, and mode of a data set.
Curated OER
Exploring Graphs
Students are introduced to connecting graphing in a coordinate plane to making scatterplots on a graphing calculator. Working in pairs, they connect points plotted to make a sailboat and complete questions on a worksheet as well as plot...
Curated OER
Scatterplot
In this scatterplot worksheet, 9th graders solve and complete 7 different problems that include defining various scatterplots. First, they use the data plotted on the scatterplot that represent the best prediction. Then, students use the...
Curated OER
Dog Days or Dog Years?
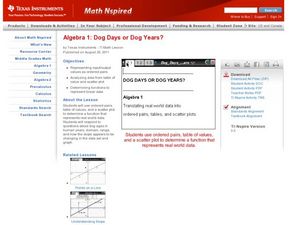
In need of some algebraic fun with real world implications?Learners use ordered pairs, a table of values and a scatter plot to evaluate the validity of several real world data sets. The class focuses on dog ages in human years, domain,...
Curated OER
Thirst Dilemma (Drinking in the Desert)
Ninth graders explore linear functions. In this Algebra I lesson, 9th graders collect and analyze date as they investigate the question of how long will water last if you are trapped in a desert. Students create scatterplots of their...
Curated OER
Line of Best Fit
Students explore the concept of linear regression. In this linear regression lesson, students do a Barbie bungee activity where they collect linear data. Students plot their data using a scatter plot. Students determine a line of best...
Curated OER
Obstacles to Success: Misleading Data
Eleventh graders explore how data reported by country agencies can mislead the public intentionally or unintentionally. In this Cross Curricular activity, 11th graders analyze charts and graphs in order to draw conclusions. Students...
Other popular searches
- Scatterplots and Correlation
- Interpreting Scatterplots
- Create Scatterplots
- Algebra 2 Scatterplots
- Drawing Scatterplots
- Explaining Scatterplots
- Scatterplots Heart
- Pre Algebra Scatterplots
- "Algebra 2" Scatterplots
- Algebra 2" Scatterplots


