Illustrative Mathematics
Telling a Story With Graphs
Turn your algebra learners into meteorologists. High schoolers are given three graphs that contain information about the weather in Santa Rosa, California during the month of February, 2012. Graph one shows temperatures, graph two...
National Academy of Sciences
CO2 and Temperature
Scientists can model global surface temperature with and without considering human emissions, but does do these factors really make a difference? Two interactive graphs demonstrate some factors that affect climate change. The first graph...
Curated OER
Graphs
In this temperature graphs instructional activity, 6th graders complete word problems based on a temperature graph of a town. Students complete 5 problems total.
Concord Consortium
Temperature and Reaction Rate
Does increasing temperature increase the rate of a chemical reaction? Junior chemists examine the effects of temperature on reaction rate using an engaging interactive. Pupils select the temperature of the reaction vessel, then observe...
Mathed Up!
Distance Time Graphs
If only there was a graph to show the distance traveled over a period of time. Given distance-time graphs, pupils read them to determine the answers to questions. Using the distance and time on a straight line, scholars calculate the...
NOAA
Climate, Weather…What’s the Difference?: Make an Electronic Temperature Sensor
What's the best way to record temperature over a long period of time? Scholars learn about collection of weather and temperature data by building thermistors in the fourth installment of the 10-part Discover Your Changing World series....
Curated OER
The Effects of Temperature on Rate
Students create predictions on what they believe happen to reaction rates when temperature is raised. They use hot, cold, and room temperature water for this experiment and observe the differences. They graph their observations and...
Curated OER
Reading Graphs
Encourage kids to read line graphs with confidence using these examples and accompanying comprehension questions. Learners examine two graphs and answer four questions about each. This is definitely intended for beginners to this type of...
Curated OER
Differences Between Ground and Air Temperatures
Students examine the differences between air temperature and ground temperature. In this investigative lesson students find NASA data on the Internet and use it to create a graph.
Kenan Fellows
Reading Airline Maintenance Graphs
Airline mechanics must be precise, or the consequences could be deadly. Their target ranges alter with changes in temperature and pressure. When preparing an airplane for flight, you must read a maintenance graph. The second lesson of...
Curated OER
Graphing the Forecast - Line Graph or Bar Graph?
Sixth graders compare and contrast bar and line graphs. Using a weather forecast of the area, 6th graders record the high and low temperatures in a table. Students determine and justify the most appropriate graph to display a given set...
NASA
Global Air Temperatures Graph: Student Activity
Analyze years of hard climate change evidence in minutes. Climatologists evaluate graphical data about climate change by answering questions. Scientists work collaboratively using a literacy cube or virtual die that directs them through...
Curated OER
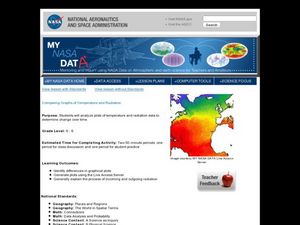
Comparing Graphs of Temperature and Radiation
Young scholars study plots and use a Live Access Server to generate plots. In this temperature instructional activity students examine the process of incoming and outgoing radiation.
NOAA
Graphing Temperatures
Battle of the hemispheres? In the fourth installment of a five-part series, young oceanographers use the NOAA website to collect temperature data from drifters (buoys), one in the Northern Hemisphere and one in the Southern Hemisphere....
Balanced Assessment
Multi-Graphs
So many things change as time goes by. Here, scholars create graphs based on this premise. Each problem asks pupils to sketch a graph that describes a given situation. Their graphs represent various characteristics such as height,...
Nuffield Foundation
Intrepreting Information about Sweating and Temperature
Why do we sweat? Scholars analyze data about body temperature, sweating, and other factors to better understand sweating. They note the changes after drinking ice water to sweating, skin temperature, and body temperature. Analysis...
STEM for Teachers
Temperature and Bounce
Take part in a fun experiment and hold an impromptu bouncing contest with your class. Young scientists heat and cool balls before bouncing them to determine whether temperature changes affect how they bounce. The set of STEM lesson plans...
Concord Consortium
Graphing Elements
How do you graph a sentence? Scholars do just that as they represent relationships between independent and dependent variables with a graphical representation. Given a sentence, they determine the pertinent relationship and create a...
Curated OER
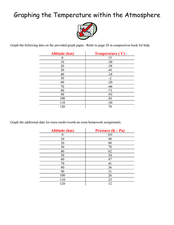
Graphing the Temperature within the Atmosphere
Musing meteorologists design graphs of the temperature and pressure changes for altitude increase in our atmosphere. The activity is pertinent to middle school earth science curriculum. Vary the type of homework you assign when teaching...
Curated OER
Investigating Properties of Water: Temperature
Investigate how temperature affects the density of water and stratification that occurs in bodies of water when temperatures vary. Water of differing temperatures is given different colors to see the layers that form. The lesson is meant...
Curated OER
Temperature and the Earth's Atmosphere
Earth science super stars visit the National Earth Science Teachers Association's interactive website to glean information on the layers of the atmosphere. Data tables are provided for them to record what is collected. This assignment...
Mathematics Assessment Project
Temperatures
As a middle school assessment task, learners first examine line graphs of monthly temperatures for two locations, and then match box plots to each line plot.
NASA
Analyzing Surface Air Temperatures by Latitude: Student Activity
Explore global temperatures from the comfort of your learning place! Meteorologists analyze surface temperatures and anomalies across different latitudes. Investigators evaluate graphs to find temperature differences and answer questions...
Pingry School
Gas Pressure and Temperature Relationship
Humans tend to huddle together when cold and move around more when warm, but do gas particles follow the same pattern? Scholars use a temperature probe, a pressure sensor, and air to study the relationship between temperature and gas...


