Radford University
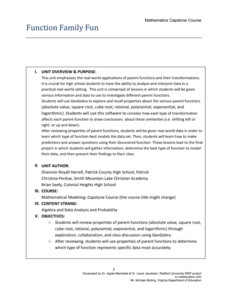
Function Family Fun
It's time for a family reunion—function families, that is. Pupils first review different types of parent functions. They then see how to apply transformations to graphs and learn how to select the most appropriate type of function to...
Radford University
Business Ownership
Let's learn a little bit about business! Given information about a t-shirt company, young mathematicians explore the revenue, costs, profits, and future sales. They develop mathematical models for these quantities using linear,...
Radford University
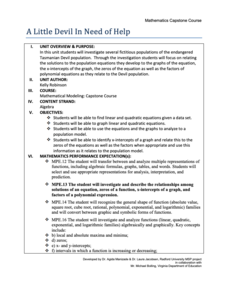
A Little Devil In Need of Help
Math modeling to help endangered species? Scholars first investigate linear and exponential equations and graphs that model fictitious animal populations. They consider how key features of the graphs relate to the situation. As a final...
Achieve
Medication Dosage
Here's the cure to boredom. Given a patient file, including medication dosage information, scholars determine the amount of medication left in the patient's bloodstream over time. They analyze the sequence of numbers and determine a...
Rice University
College Algebra
Is there more to college algebra than this? Even though the eBook is designed for a college algebra course, there are several topics that align to Algebra II or Pre-calculus courses. Topics begin with linear equation and inequalities,...
Rice University
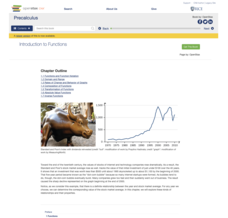
Precalculus
Take a step beyond Algebra 2. Learners use the eBook to learn concepts from the typical Precalculus course. Content starts off with a short review of functions in general and moves on to the basic functions, finishing up with more...
Rice University
Algebra and Trigonometry
Move on into trigonometry. An informative eBook takes the content of a College Algebra course and adds more relating to trigonometry and trigonometric functions. The content organization allows pupils to build upon their learning by...
Rice University
Intermediate Algebra
Algebra concepts are all wrapped up in one nice bow. The resource combines all the concepts typically found in Algebra I and Algebra II courses in one eBook. The topics covered begin with solving linear equations and move to linear...
Pace University
Grades 9-10 Algebra: Graphic Quadratics on the Coordinate Plane
Find quadratics in the world. Learners select ways to compare and contrast linear and quadratic functions and how to demonstrate knowledge of parabolas in the world. Teachers assign a third task challenging individuals to find equations...
Concord Consortium
Quadratic Reflections
Reflect upon the graphs of quadratic functions. Given a quadratic function to graph, pupils determine whether the graph after a horizontal and vertical reflection is still a function. The final two questions ask scholars to describe a...
Concord Consortium
Rational and Not So Rational Functions
Do not cross the line while graphing. Provided with several coordinate axes along with asymptotes, pupils determine two functions that will fit the given restrictions. Scholars then determine other geometrical relationships of asymptotes...
Concord Consortium
People and Places
Graph growth in the US. Given population and area data for the United States for a period of 200 years, class members create graphs to interpret the growth over time. Graphs include population, area, population density, and population...
PHET
Graphing Quadratics
Quadratics only have three terms, but each one is fairly important. Scholars use an interactive to explore how each coefficient affects the graph of a quadratic function. They also see how changes to the vertex form and how changes to...
PHET
Graphing Lines
Ready to increase pupils' understanding of slope with an upward slope? Scholars use an interactive that allows users to move two points on a coordinate plane. The interactive then automatically calculates the slope, the slope-intercept...
Mathed Up!
Drawing Quadratic Graphs
Curve through the points. The resource, created as a review for the General Certificate of Secondary Education Math test, gives scholars the opportunity to refresh their quadratic graphing skills. Pupils fill out function tables to find...
Mathed Up!
Straight Line Graphs
Develop graphs by following the pattern. The resource provides opportunities for reviewing graphing linear equations. Pupils create tables to graph linear equations by using patterns whenever possible. The worksheet and video are part of...
Howard Hughes Medical Institute
Evolution in Action: Data Analysis
An environmental factor, such as a drought, sometimes speeds up the rate of natural selection. Scholars analyze data on the beaks of birds around the time of the drought. They compare those that survived to those that perished and find...
Mathematics Vision Project
Module 4: Polynomial Functions
Bridge the gap between graphical and algebraic representations. Learners complete six lessons that begin by pointing out connections between the key features of a polynomial graph and its algebraic function. Later, pupils use the...
CCSS Math Activities
Smarter Balanced Sample Items: High School Math – Target M
Your knowledge of graphs is a function of how much you try. Young mathematicians work on a set of 12 questions that covers graphing functions, comparing functions, and rewriting functions in different forms to determine key features....
Concord Consortium
Losing Track
Don't lose the chance to use the task. Given three diagrams of curved pieces of wires, young mathematicians must explain whether it's possible to conclusively match the wires as representing cubic, exponential, or quadratic functions....
Mathematics Vision Project
Module 2: Logarithmic Functions
You can't build a fire with these logs! Filled with hands-on investigations, a complete logarithmic unit offers both instruction and practice. Learners first build an understanding of the new function, then explore properties before...
Concord Consortium
Sum and Product
From linear to quadratic with a simple operation. An exploratory lesson challenges learners to find two linear functions that, when multiplied, produce a given parabola. The task includes the graph of the sum of the functions as well as...
Concord Consortium
Graphical Depictions
Parent functions and their combinations create unique graphical designs. Learners explore these relationships with a progressive approach. Beginning with linear equations and inequalities and progressing to more complex functions,...
Concord Consortium
Functions by the Slice
Piece by piece ... dismantling a function can highlight interesting patterns. The task asks learners to slice functions in sections with the same vertical change. They then recreate the graph with these slices positioned horizontally....


