Concord Consortium
All-in-All Problems
Graphs, functions, symbols, and more! Use these strategies to model everything from the flow of a river to the number of cars passing a toll booth. Presented differently but solved similarly, learners consider five different scenarios...
101 Questions
Basketball Shots
Shoot for greater understanding of systems. Pupils watch a short video of a man attempting basketball shots, both one-point free throws and two-point field goals. Given the total number of shots and total number of points made, viewers...
101 Questions
The Mystery Line
Take the mystery out of linear functions. Provided an image with no scale, learners guess where the line that connects them might cross the y-axis. After providing the coordinates of the points, they realize scale is an important...
Kenan Fellows
Dinner Party: Using Pattern Trains to Demonstrate Linear Functions
Nothing fancy here ... just your run-of-the-mill Algebra party! Learners explore the patterns of linear functions while designing seating arrangements for a dinner party. Comparing the number of tables to the perimeter of the combined...
Kenan Fellows
Applying Linear Regression to Marathon Data
It's not a sprint, it's a marathon! Statistic concepts take time to develop and understand. A guided activity provides an opportunity for individuals to practice their linear regression techniques in spreadsheet software. The activity...
Howard County Schools
Exponential Decay Exploration
How can you model exponential decay? Explore different situations involving exponential decay functions and decreasing linear functions by performing activities with MandM candy, popcorn kernels, and number cubes.
101 Questions
Chalk Lines
Read between the lines to find a solution. Budding mathematicians analyze a situation to solve a problem. They view a video presentation of the problem, brainstorm important information to gather, and write linear equations to find...
National Research Center for Career and Technical Education
Break-Even Point
How do companies determine the prices of their products? Marketing maestros discover the concepts of cost and break-even point through discussion, independent practice, and a collaborative assessment. The career and technology-oriented...
Shodor Education Foundation
Equation Solver
Solve your equation and prove it, too. Young mathematicians solve linear equations using an interactive. They must input a property to justify each step of their solutions.
Shodor Education Foundation
Algebra Quiz
Reviewing the process of solving equations is as easy as one click of a button. Scholars solve linear and quadratic equations by using a helpful interactive. The computer app automatically scores responses, providing immediate feedback...
Shodor Education Foundation
Algebra Four
Everybody wins when you play Algebra Four. Players solve linear and quadratic equations to earn pieces on the Algebra Four game. Make a row of four pieces and you win the game. But everyone gets practice with solving equations, so really...
Cornell University
Math Is Malleable?
Learn about polymers while playing with shrinky dinks. Young scholars create a shrinky dink design, bake it, and then record the area, volume, and thickness over time. They model the data using a graph and highlight the key features of...
Shodor Education Foundation
Regression
How good is the fit? Using an interactive, classmates create a scatter plot of bivariate data and fit their own lines of best fit. The applet allows pupils to display the regression line along with the correlation coefficient. As a final...
West Contra Costa Unified School District
Average Rate of Change
The concept of slope gets an approachable, yet theoretical, treatment in a comprehensive algebra lesson. The use of functional notation and problem-solving techniques keep the material rigorous, but detailed teaching notes and lots of...
GeoGebra
All For One, One For All
Will someone please constrain those pets? Pupils create two constraint equations on the number of cats and dogs for a pet sitter. They choose specific points and determine whether the point satisfies one or both constraints. The...
Georgetown University
Cup-Activity: Writing Equations From Data
Determine how cup stacking relates to linear equations. Pupils stack cups and record the heights. Using the data collected, learners develop a linear equation that models the height. The scholars then interpret the slope and the...
GeoGebra
Pet Sitters Feasible Region
Find the best way to maximize the profit. Pupils graph four constraints of a pet-sitting company, using a revenue equation to find a maximum amount the sitters can earn. By using the equation, scholars determine the number of cats and...
GeoGebra
Too Big, or Not Too Big
Determine whether the point is just right. The interactive allows participants to input a constraint equation. Pupils pick a point and determine whether it is too big, not too big, or just right for the constraint. Using the graphing...
CK-12 Foundation
Checking Solutions to Equations: Taxi Cab Calculations
Ride to success in checking solutions to equations. Scholars use an interactive graph to identify points that are solutions to a linear equation. Interpreting these points in terms of the context completes the activity.
CK-12 Foundation
Input-Output Tables for Function Rules
How does changing a graph affect the function? Learners watch the changing input-output table as they adjust the location of the line graph. Questions prompt them to complete a table of values and determine the function rule.
CK-12 Foundation
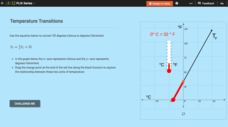
Linear Equations: Temperature Transitions
Explore linear conversions using an engaging interactive lesson. Learners drag a point on a graph to discover the equivalent degrees in Fahrenheit and Celsius. Embedded questions highlight key features such as slope and the y-intercept.
CK-12 Foundation
Intercepts and the Cover-Up Method: The Hidden Zeros
There's no need to cover up this resource — it's good one! Pupils use a slider interactive that covers up parts of the standard form of a linear equation and simultaneously reveals one of the intercepts of the graph. This lets them see...
CK-12 Foundation
Slope: Danger Mountain
There's no danger in using an exciting resource. Pupils use an interactive to change the slope of a sledding path and see how the equation changes. They then apply information about safe slopes to see if their sledding paths are...
CK-12 Foundation
Graphs Using Slope-Intercept Form: Zip-Line
Zip lines aren't so scary when all your scholars use them for is math. Young mathematicians see how the slope of a zip-line to a building changes as the height changes. They answer a set of challenge questions regarding the scenario.


