Cornell University
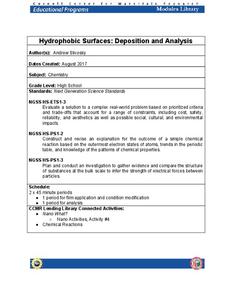
Hydrophobic Surfaces—Deposition and Analysis
Couches, carpets, and even computer keyboards now advertise they are spill-resistant, but what does that mean? Scholars use physical and chemical methods to coat surfaces with thin films to test their hydrophobic properties. Then they...
National Wildlife Federation
Quantifying Land Changes Over Time Using Landsat
"Humans have become a geologic agent comparable to erosion and [volcanic] eruptions ..." Paul J. Crutzen, a Nobel Prize-winning atmospheric chemist. Using Landsat imagery, scholars create a grid showing land use type, such as urban,...
Curated OER
2006 U.S. National Chemistry Olympiad Part III
In this chemistry Olympiad lab worksheet, students are given two lab problems to design experiments. Topics include determining the mass percentage of a given compound and determining an unknown metal using quantitative and qualitative...
Curated OER
Quantifiers
Many people, regardless of their age, confuse similar words. Little or few, much or many, some or any...the list goes on and on! Use this online resource to test your learners' ability to choose the correct quantifier. Consider using...
K20 Learn
Bavaria Has Issues...Experimental Components
New ReviewDo you want to be a detective by analyzing situations? An engaging lesson provides young historians with the tools to help them understand the difference between data types and how to analyze them to draw conclusions. Scholars complete...
National WWII Museum
Rationing by the Numbers: Quantitative Data as Evidence
What was it like to live on wartime rations in the United States during World War II? Young historians find out by exploring how those on the home front bought food thanks to the ration system. Other data includes statistics on car sales...
CCSS Math Activities
Smarter Balanced Sample Items: 6th Grade Math – Target G
Making money and saving money turn into high interest topics for sixth graders. Grade 6 Claim 1 Item Slide Shows use these topics in a presentation with math practice problems. The questions require applying knowledge of algebraic...
College Board
Is That an Assumption or a Condition?
Don't assume your pupils understand assumptions. A teacher resource provides valuable information on inferences, assumptions, and conditions, and how scholars tend to overlook these aspects. It focuses on regression analysis, statistical...
Corbett Maths
Quantitative and Qualitative Data
Classify the Big Ben of all data with a video that defines quantitative and qualitative data. Given data about Big Ben, the presenter classifies each piece based upon the definitions. In the Types of Data worksheet, individuals show they...
Pingry School
An Introduction to Qualitative Analysis
Compounds take on different properties than their elemental components. How can scientists determine those elements? A lab-based activity has learners explore several double replacement reactions to analyze compounds qualitatively. They...
University of North Carolina
Sociology
What exactly does sociology entail? Sociology is a broad field that covers many topics, including culture, mass media, and social movements. A helpful handout prepares scholars for typical writing found in college-level sociology...
Cornell University
Density
Certain things just do not mix, including liquids of varying densities. Learners collect data to determine the densities of several liquids. They then use the density information to predict the type of liquid.
Code.org
Cleaning Data
"Clean the data!" "I did not know it was dirty." Introduce your class to the process of cleaning data so that it can analyze it. Groups work through a guide that demonstrates the common ways to filter and sort data. Pairs then...
Curated OER
Describing Data
Your learners will practice many ways of describing data using coordinate algebra in this unit written to address many Common Core State Standards. Simple examples of different ways to organize data are shared and then practice problems...
Curated OER
How a Writer Conveys Descriptions With a Wallop Lesson 3 for Running (From River Town)
Learners examine strategies an author uses to provide qualitative and quantitative aspects of life in China. They apply the strategies to their own writing.
Curated OER
Dot Plots
Number crunching statisticians explore displaying data with dot plots and define the difference between quantitative data and qualitative data. Dot plots are created based on a set of given data and analyzed.
Curated OER
Applied Science - Science and Math Lab 4B
Learners experiment with the combination of vinegar and baking soda. In this applied science lesson, future scientists compare qualitative and quantitative data collected from their exploration. Then they work together to analyze and...
Curated OER
Bloodstain Pattern Simulations: A Physical Analysis
Students receive bloodstain pattern evidence from a crime scene. They answer a series of questions through inquiry, observation, measurement, and analysis. Pupils complete this challenge, by reconstructing the evidence through four...
Curated OER
Applied Science - Science and Math Pre-Lab 4C
Scholars classify the sciences. Using applied science, they compare and contrast subfields of sciences. They compare qualitative versus quatitative. They discuss types of sciences and the meanings of the word roots of the names.
Curated OER
Applied Science - Science and Math Post-Lab
Students explore optical illusions. In this Applied Science lesson, students view optical illusions and record the data of what they see. Students graph the data that they collect.
Curated OER
Quantifier Exercises
In this quantifiers online interactive activity, students complete 12 sentences by supplying the appropriate adjective that completes each one grammatically correct. Students rewrite 10 sentences using negative quantifiers. Students...
Curated OER
English Exercises - Quantifiers
In this use of quantifiers online worksheet, 4th graders fill in 6 blanks associated with clip art pictures using either "a" or "an." They fill in 18 blanks with "some" or "any" to complete sentences. They use "how much" or "how many" to...
Curated OER
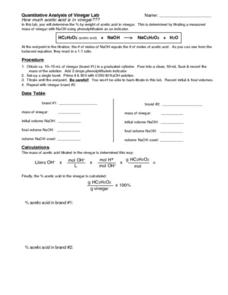
Quantitative Analysis of Vinegar Lab
In this quantitative analysis worksheet, learners perform a lab to determine the amount of acetic acid in vinegar by doing a titration. They use an indicator phenolphthalein to determine the endpoint of the titration.
Curated OER
Verbal and Algebraic Expressions
In this expressions worksheet, students solve and complete 30 various types of problems that include defining both verbal and algebraic expressions. First, they translate each verbal expression into an algebraic expression and vice...


