Shodor Education Foundation
Experimental Probability
Spin into a dicey experiment. Pupils use a spinner or a pair of dice to determine the experimental probabilities of each outcome. The interactive allows for either, one, five, or ten consecutive experiments. Using the applet, learners...
Shodor Education Foundation
Coin Toss
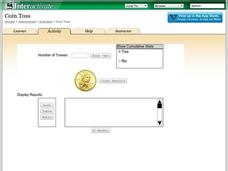
Are your young mathematicians having a hard time making heads or tails of probabilities? It's no toss up—here is a resource that's sure to straighten them out! Learners run the interactive to toss a coin a different number of times....
Shodor Education Foundation
Simple Monty Hall
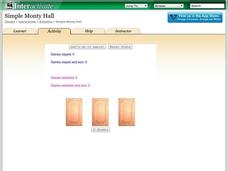
What's behind door number one? A fun resource lets learners simulate the classic Monty Hall probability problem. Pupils choose a door, and after they select a losing door, they decide whether to switch or stay. Using their decisions, the...
CK-12 Foundation
Additive and Multiplicative Rules for Probability: Red Dress? Blue Dress? Both!
The sum of the parts is greater than the whole. An interactive uses a Venn-like model to show the percentage of females from a survey that have a blue dress, a red dress, or both. The pupils determine the numbers in each category...
CK-12 Foundation
Numerical Computations: Counting Out Probability
Keep your heads up while counting. Pupils use an interactive to create a table with the possible outcomes of flipping three coins and then determine the probabilities of getting certain combinations of heads and tails.
CK-12 Foundation
Theoretical and Experimental Probability: Pizza Night!
Take a bite out of an enticing resource. Scholars use an interactive to study dependent events. They see how the number of favorable outcomes and total number of outcomes changes as individuals "eat" pieces of pizza.
CK-12 Foundation
Expected Value: Win a Dollar
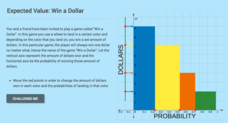
Spin a wheel, land on a color ... and win. Learners create a graph to display the probabilities of the amount of money they can win by spinning a colored wheel. The pupils use the dollar amounts and their probabilities to calculate the...
CK-12 Foundation
Expected Value: Game of Chance
Determine whether the payoff is worth it. Pupils calculate the expected value of a game with three different payoff levels. Each level has a different probability of winning money. The scholars find the expected payoffs for each level...
CK-12 Foundation
Expected Value: Creating a Discrete Probability Distribution Table
Wanna roll the dice? Determine whether it is a good idea to play a dice game. An interactive presents the rules for a game of dice. Pupils find the probabilities of each event and calculate the expected value of the game. They finish...
CK-12 Foundation
Binomial Distributions and Probability: Roll One!
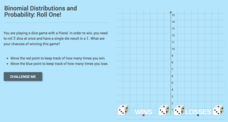
It takes exactly one to win. Pupils calculate the probability of rolling five dice and having only a single die come up with a one. Learners calculate the number of expected wins out of a series of games. The interactive provides...
CK-12 Foundation
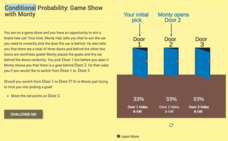
Conditional Probability: Game Show with Monty
The car is behind door one — no wait, it is behind door three. An interactive allows learners to visualize the Monty Hall problem. Pupils work through the probabilities of choosing the car with their first pick. Next, they determine...
CK-12 Foundation
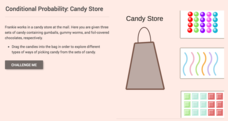
Conditional Probability: Candy Store
An interactive uses a candy store to involve the pupils in conditional probabilities. Learners determine probabilities as customers purchase different types of candies and the stock decreases.
CK-12 Foundation
Geometric Probability: Dartboard
Get your class on target with probability using an exciting resource. The interactive presents three square dartboards with different target areas, which are combinations of square units. Pupils determine the probabilities of randomly...
CK-12 Foundation
Counting Events: Flipping Unfair Coins
Who said life was fair? An interactive uses an area diagram to represent the probabilities of flipping unfair coins. Pupils use the diagram to calculate the probabilities of outcomes of flipping the two coins. The scholars must decide...
EngageNY
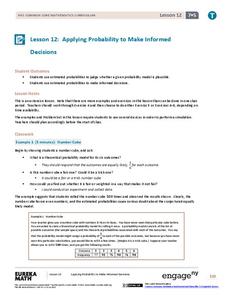
Applying Probability to Make Informed Decisions
Use simulations to determine the probabilities of events to make decisions. Class members are presented with several scenarios, some with known probabilities and others without. Groups run simulations to gather data that they then use to...
EngageNY
Using Tree Diagrams to Represent a Sample Space and to Calculate Probabilities
Cultivate the tree of knowledge using diagrams with two stages. Pupils create small tree diagrams to determine the sample space in compound probability problems. The lesson uses only two decision points to introduce tree diagrams.
EngageNY
Chance Experiments with Outcomes That Are Not Equally Likely
The fifth portion of the 25-part series introduces probabilities calculated from outcomes that are not equally likely. Class members use tables to calculate probabilities of events, add outcome's probabilities, and find complements....
EngageNY
The Difference Between Theoretical Probabilities and Estimated Probabilities
Flip a coin to determine whether the probability of heads is one-half. Pupils use simulated data to find the experimental probability of flipping a coin. Participants compare the long run relative frequency with the known theoretical...
EngageNY
Mid-Module Assessment Task: Grade 7 Mathematics Module 5
Determine the probability that the class knows probability. The three-question assessment presents problems with finding the sample space and the probability, theoretical and experimental, of a variety of situations. Pupils also describe...
EngageNY
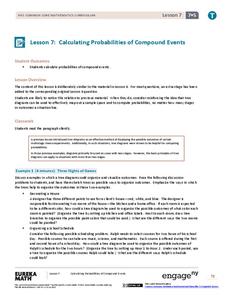
Calculating Probabilities of Compound Events
Use tree diagrams with multiple branches to calculate the probabilities of compound events. Pupils use tree diagrams to find the sample space for probability problems and use them to determine the probability of compound events in the...
EngageNY
Calculating Probabilities for Chance Experiments with Equally Likely Outcomes
Calculate theoretical probabilities and compare them to experimental probabilities. Pupils build on their knowledge of experimental probabilities to determine theoretical probabilities. Participants work several problems with the...
Virginia Department of Education
Normal Distributions
Pupils work to find probabilities by using areas under the normal curve. Groups work to calculate z-scores and solve real-world problems using the empirical rule or tables.
Mathematics Assessment Project
Statistics and Probability
Quickly assess basic understandings of statistics and probability. The resource contains five quick tasks from the probability and statistics domain. The questions range from finding simple conditional probabilities to measures of center...
Mathed Up!
Probability
How likely is it to draw a blue marble? Pupils find the likelihood of events and connect that to the probability of the event. They find the probabilities of simple events and show their probabilities on a scale.


