Utah Education Network (UEN)
Statistics
Find the value in analyzing data values. Statistics is the focus in the fifth of seven installments of the 6th Grade Math series. Individuals learn to examine dot plots, histograms, and box plots by considering the shape, mean, median,...
Bowland
Tuck Shop
Correct a misleading conclusion. Individuals review a set of data and a conclusion to determine what is wrong with the conclusion. Pupils then represent the data with an appropriate display. Finally, learners develop a correct conclusion...
Bowland
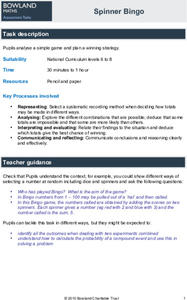
Spinner Bingo
Create a winning card. Given a description of a bingo game using two spinners, pupils determine which of three cards has the greatest chance of winning. Scholars then determine which are the best numbers to put on their own cards to give...
Bowland
Counting Trees
Let's find a way to determine how many there are. Given a diagram of trees on a plantation, pupils devise a way to estimate the number of old and new trees. Using their methods, learners create estimates for the number of the two types...
Bowland
Lottery
Take a chance on raising money. Learners calculate probabilities to determine whether a lottery is a good way to raise money. Pupils determine the number of combinations of choosing two numbers between one and six. Using the sample...
EngageNY
Selecting Evidence and Partner Writing: Aligning “The Hero’s Journey” and The Lightning Thief (Chapter 5)
Around and around we go! Scholars work in groups to connect The Hero's Journey and The Lightning Thief with a Carousel of Quotes activity. They then independently reflect on the two texts and answer questions about how they connect to...
US Department of Commerce
Immigration Nation
People come and people go. Given tabular census data on the annual number of immigrants from four different regions of the world between 2000 and 2010, pupils create double bar graphs and line graphs from the data. They analyze their...
US Department of Commerce
Exploring Sampling Variability - Higher Education Attainment Across The United States
More education in statistics is always beneficial. Given cards that provide the proportion of adults with bachelor's degrees in 10 random US states, scholars individually determine the sample percentage of states in which more than 30...
US Department of Commerce
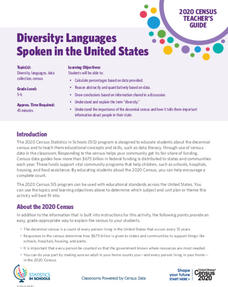
Diversity: Languages Spoken in the United States
High schoolers begin a discussion on diversity and determine the percent of the population that speak another language at home in the US. Classmates make a prediction of the percentage of people that speak another language at home in...
US Department of Commerce
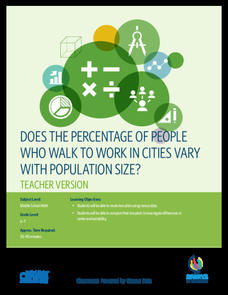
Does the Percentage of People Who Walk to Work in Cities Vary with Population Size?
To walk or not to walk? Pupils create box plots comparing the percentage of residents who walk to work in large, medium, and small cities. Using the box plots, class members compare the data that reflects available statistics. Scholars...
US Department of Commerce
Looking at Numbers of Births Using a Line Graph
Was there a baby boom? Using census data, class members take a look at the number of 8-11 year olds and determine their birth years. Scholars create a double line graph to compare the number of births for two states for several years....
National Wildlife Federation
Gator Hole Graphics
Climate changes are cyclic so how do these changes impact species that live in different habitats? Learners examine the rainfall levels in a specific swamp habitat. They also review graphical data and tell a story about how the levels...
CK-12 Foundation
CK-12 Middle School Math Concepts - Grade 6
Twelve chapters cover a multitude of math concepts found in the Common Core standards for sixth grade. Each title provides a brief explanation of what you will find inside the chapter—concepts from which you can click on and learn more...
National Museum of Mathematics
Hands-On Data Analysis
Jump at the chance to use this resource. A kinesthetic activity has classmates jumping in several different ways (standing, single-step, and multiple-step jumps) to create handprints on poster paper taped to the wall. They measure the...
McGraw Hill
Lesson 12: Absolute Mean Deviation
Learn a different way to determine variability. An informative lesson plan provides directions on how to calculate the mean absolute deviation of a data set. Pupils use examples to learn the process and then practice finding the mean...
Newspaper Association of America
By the Numbers: Mathematical Connections in Newspapers for Middle-Grade Students
A cross-curricular resource teaches and reinforces mathematical concepts with several activities that use parts of a newspaper. Scholars use scavenger hunts to find the different ways math is used in the paper along with using data...
American Statistical Association
Speedster
Catch me if you can. Scholars collect data on reaction time by catching a falling ruler or by using an Internet app. They determine the median of the data, create graphs, and analyze the results. They also compare their data to the rest...
American Statistical Association
The Taste of Yellow
Does lemonade taste better when yellow? A tasty experiment has scholars determine the answer to the question. It requires conducting a taste test with lemonades of different colors (from food coloring), and then collecting and analyzing...
American Statistical Association
Spinners at the School Carnival (Unequal Sections)
Everyone's a winner. Scholars analyze a spinner with five unequal sections, three of which represent winning a toy car and the other two represent winning a toy truck. They conduct an experiment to estimate the number of toy cars and...
American Statistical Association
Spinners at the School Carnival (Equal Sections)
Spin to win a toy car. A fun activity has pupils use a spinner in which three of the equal sections represent winning a toy car, and the fourth section represents no car. They record the number of wins after certain numbers of spins,...
American Statistical Association
Candy Judging
Determine the class favorite. The statistics lesson plan has pupils collect, display, and analyze data. Pairs rank four kinds of candy based on their individual preferences. Working as an entire class, learners determine a way to display...
PHET
Plinko Probability
It's a good thing the resource dropped into your radar. Young mathematicians use an app that randomly drops balls through a Plinko game and into bins. They compare the distribution to that of an ideal binomial distribution.
CCSS Math Activities
Smarter Balanced Sample Items: 6th Grade Math – Target J
What is the best measure of central tendency? Scholars explore mean, median, mode, range, and interquartile range to understand the similarities and differences. They display data in dot plots, histograms, box plots, and more as part of...
CCSS Math Activities
Smarter Balanced Sample Items: 6th Grade Math – Target I
Scholars apply their knowledge of statistical questions to determine which questions meet the criteria. Grade 6 Claim 1 Item Slide Shows offers a couple of practice problems for scholars to discuss.


