EngageNY
Describing the Center of a Distribution Using the Mean
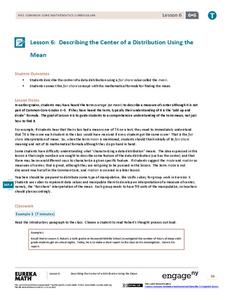
Everyone does their fair share. The sixth segment in a 22-part unit presents the mean as a fair share. Groups build a conceptual understanding of the mean of a data set, rather than simply learn an algorithm. Learners use the...
EngageNY
Describing Center, Variability, and Shape of a Data Distribution from a Graphical Representation
What is the typical length of a yellow perch? Pupils analyze a histogram of lengths for a sample of yellow perch from the Great Lakes. They determine which measures of center and variability are best to use based upon the shape of the...
American Statistical Association
Armspans
Young mathematicians collect data on the arm spans of classmates. Then they sort the data by measures of center, spread, and standard deviation. Finally, they compare groups, such as boys and girls, to interpret any differences.
EngageNY
Displaying a Data Distribution
Pupils analyze a display of data and review dot plots to make general observations about the highest, lowest, common, and the center of the data. To finish, learners match dot plots to scenarios.
Curated OER
Rebuilding The World Trade Center Site: A 9/11 Tribute
Students work together to build a memorial for the World Trade Center victims. In groups, they draw designs on what they believe the memorial should look like and write a proposal for the structure. To end the lesson, they present...
EngageNY
Describing the Center of a Distribution Using the Median
Find the point that splits the data. The lesson presents to scholars the definition of the median through a teacher-led discussion. The pupils use data lists and dot plots to determine the median in sets with even and odd number of data...
EngageNY
Summarizing a Data Distribution by Describing Center, Variability, and Shape
Put those numbers to work by completing a statistical study! Pupils finish the last two steps in a statistical study by summarizing data with displays and numerical summaries. Individuals use the summaries to answer the statistical...
Mathematics Assessment Project
Mean, Median, Mode, and Range
What a find! Here is a instructional activity, designed to meet sixth grade math Common Core standards, that focuses on the calculation of different measures of center for the scores from a penalty shoot-out competition. An independent...
Curated OER
Center of Attention
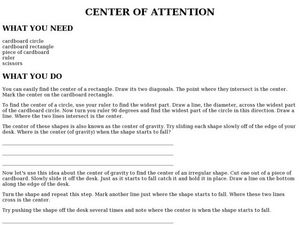
In this finding the center worksheet, students find the center of a rectangle and a circle by using cardboard and a ruler. Students then answer 2 questions.
Curated OER
Data Analysis
Young statisticians use and interpret measures of center and spread such as mean, median, and mode as well as range. They use box plots to represent their data and answer questions regarding the correspondence between data sets and the...
Curated OER
Mirror, Mirror
Geometry students use hinged mirrors to discover that the regular polygons are composed of triangles tessellating around a center point. They sketch triangles on paper models of the regular polygons having 3 to 10 sides and compute the...
CK-12 Foundation
Mode: Boxes of Oranges
See how your data stacks up. Pupils stack crates of oranges in increasing order, creating a simple bar graph. Using the graph, individuals determine measures of center and describe the shape of the distribution. Scholars determine what...
Curriculum Corner
Winter Multiplication and Division Problem Solving Task Cards
A set of 18 winter-themed multiplication and division word problems is perfect for your math centers right before the holidays. Each problem is numbered and represented on a task card. Young mathematicians write their answers on a...
Curated OER
Rotations
In this rotations activity, students draw and label a rotated image for each triangle and label its center. Students complete 6 problems.
Curated OER
Dilations
In this dilations instructional activity, students draw and label dilated images for the triangles and label the centers. Students complete 6 problems total.
Curated OER
Circle Graphs
In this circle graphs worksheet, students solve and complete 8 different problems that include word problems referring to two different circle graphs shown. First, they follow the directions for each problem and complete the table that...
Illustrative Mathematics
Pennies to Heaven
Even though pennies seem to be relatively thin, stack enough of them into a single stack, and you could have quite a high stack. Enough so, that the final result can be a surprise to you as well as your class. This activity centers...
American Statistical Association
How Fast Are You?
Quick! Snap up the lesson. Scholars first use an online app to collect data on reaction times by clicking a button when the color of a box changes. They then plot and analyze the data by considering measures of center, measures of...
Curated OER
Math Learning Center: High Flyin' Math Facts
In this High Flyin' math facts worksheet, students participate in an activity that combines various math problems that match up with each answer on the bows of the kites.
Curated OER
Seven up!
In this number puzzle worksheet, learners put numbers in the puzzle so that the numbers across from each other all add up to the center number. Students put numbers one through 7 in the puzzle.
Shodor Education Foundation
Plop It!
Build upon and stack up data to get the complete picture. Using the applet, pupils build bar graphs. As the bar graph builds, the interactive graphically displays the mean, median, and mode. Learners finish by exploring the changes in...
American Statistical Association
What is the Probability of “Pigging Out”
Learners apply their understanding of luck to a probability experiment. They play a game of Pass the Pigs to determine the probability of a specific outcome. Using analysis for their data, pupils declare the measures of center, dot...
Illustrative Mathematics
Rectangle Perimeter 2
While this activity is centered around expressions that represent the perimeter of a rectangle, it also hits at the fundamental concept of equivalent expressions, simplifing expressions, and like-terms. Classmates express their...
Curriculum Corner
Fraction Brochures
Make fractions fun and interesting by using a brochure form. Young mathematicians practice and gain a better understanding of how to add and subtract fractions, simplify fractions, and find LCD (least common denominator). The resources...
Other popular searches
- Center of Gravity
- World Trade Center
- Literacy Centers
- Media Center
- Kindergarten Math Center
- Math Centers
- Hands on Centers
- Money Math Centers
- Center for Disease Control
- Center of Circle
- Center of Gravity Activities
- Math Center Activities


