Virginia Department of Education
Balancing Act
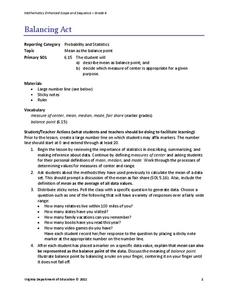
How many different interpretations of the mean are there? Scholars place numbers on a number line and determine the mean. They interpret the mean as the average value and as the balance point.
Beyond Benign
Leave Only Footprints
You don't need to tip-toe around an enlightening resource. Young environmentalists learn about ecological footprints in the fourth lesson plan of 15. Answering a questionnaire helps them see how their own families and homes affect the...
CK-12 Foundation
Length of an Arc: Pi Hour
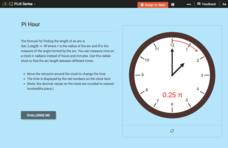
What time is it when the arc length is pi? An interactive displays the measure of the angle created between the hour and minute hand of a clock. Pupils can set the clock to different hours and calculate the arc length based upon the radius.
Workforce Solutions
30 Seconds
Thirty seconds are all scholars have to develop an engaging commercial to showcase their talents and experience within a specific occupation. Pairs work collaboratively to keep each other on time to deliver information speedily and ask...
Mathematics Vision Project
Circles: A Geometric Perspective
Circles are the foundation of many geometric concepts and extensions - a point that is thoroughly driven home in this extensive unit. Fundamental properties of circles are investigated (including sector area, angle measure, and...
College Board
Teaching Students How to Write AP Statistics Exam Responses
But this is math—we don't need to know how to write! The article makes a point that class members in AP® Statistics should be comfortable writing as the exams require it. Individuals quickly realize that quality writing is crucial to a...
Virginia Department of Education
Numbers in a Name
What's in a name? Pupils create a data set from the number of letters in the names of classmates. Each group then takes the data and creates a visual representation, such as a histogram, circle graph, stem-and-leaf plot, etc.
Other popular searches
- Main Idea Central Idea
- Central Idea Poetry
- Reading Central Idea
- Organizing Central Idea
- Supporting a Central Idea
- Central Idea Mini Lesson
- Central Idea Mini
- Central Idea and Details
- Determining Central Idea
- Central Idea and Theme


