Curated OER
Did Voters Turn Out -- or Are They Turned Off?
What was the voter turnout at your last state election? Examine voter turnout statistics from the most recent election to learn which ten states have the best turnout record. This lesson offers election data, handouts, and worksheets.
Curated OER
Mean in Statistics: Practice Finding Averages
Using an online, interactive practice exercise, learners calculate the mean of six sets of numbers. A handy tool to provide practice or assess mastery. Immediate feedback notes correct responses and leaves incorrect ones in place so...
PBS
Button, Button
Youngsters count, classify, and estimate quantities using buttons after a read aloud of The Button Box by Margarette S. Reid. They discuss the difference between guessing and estimating. Based on an experiment, they predict the number of...
Curated OER
What Is A Rate? Practice Sheet
Your mathematicians practice expressing rates with ratios. They identify from among 12 ratios the ones that are unit rates. They express six given situations as two equal rates each. Finally, they interpret data about fuel efficiency...
Curated OER
Conditional Probability and Probability of Simultaneous Events
Your statisticians examine the characteristics of conditional probability and the probability of simultaneous independent events. They perform computer activities to find probabilities for simple compound events. They examine the...
Curated OER
It Has Been Rubbish For Years
Students are presented with the problems of percentages and focus upon numbers in contrast to 100. They calculate problems with money and are engaged with the use of games as a teaching tool. Students also interpret data as presented in...
Curated OER
Math - Blank Jeopardy
Double Jeopardy! Review polynomials, statistics, triangles, graphing, mode, median, mean, measurement, slope, distance, and ratio. Note: Have everyone use a white board to do the problems to get a quick check on understanding.
Curated OER
Unexpected Answers
High schoolers explore the concept of fairness. In this fairness lesson, students play four probability games. High schoolers determine who has the best chance of winning each of the four games. Students discuss which games gave an...
Curated OER
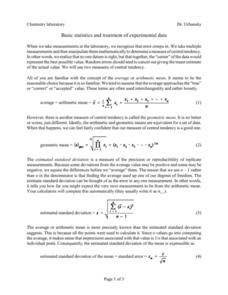
Basic Stats
In this chemistry worksheet, students focus upon the concepts of mean and standard deviation and how it is used in the laboratory to interpret data.
Curated OER
Penny Basketball: Making Sense of Data
Explore four web-based interactive sites to develop a baseline understanding of statistics. Learners play a series of penny basketball games and collect data regarding their shooting statistics. Groups decide who is the "top" penny...
Curated OER
Do You Feel Lucky?
Students explore probability by using games based on probable outcomes of events. They name all of the possible outcomes of an event and express the likelihood of such an event occurring.
Curated OER
Baseball Stats
Students explore data sheets and statistics in baseball. They use baseball data available on the Internet to develop an understanding of the different ways in which data can be analyzed.
Curated OER
Energy Conservation Lesson 1: Fossil Fuels and the Ticking Clock
Students explore energy production by participating in a class discussion. In this renewable energy lesson, students discuss the differences between solar, coal, wind and fossil fuel energy sources and why some are better for the...
Curated OER
Why Doesn't My New Shirt Fit?
High schoolers test Leonardo da Vinci's view of the human body by measuring various body parts using a tape measure. They create a data table and a scatter plot and then analyze and interpret the results using a graphing calculator.
Curated OER
What's Your Shoe Size? Linear Regression with MS Excel
Learners collect and analyze data. In this statistics lesson, pupils create a liner model of their data and analyze it using central tendencies. They find the linear regression using a spreadsheet.
Curated OER
The Way to Better Grades!
Pupils collect and analyze data. In this statistics activity, learners create a scatter plot from their collected data. They use, tables and graphs to analyze the data and mae decisions.
Curated OER
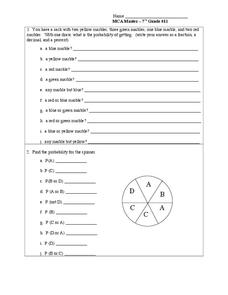
Probability
Seventh graders solve and complete 2 different problems that include a number of other possibilities. First, they draw a marble as stated for each out of a sack of marbles and determine the probability of getting that particular marble....
Curated OER
Surveys and Sampling Methods
Math whizzes select the statement that best describes the type of sampling being described. Each of the five problems describes a situation and students are presented with options options. An interactive hint button is provided for each...
Curated OER
Statistics
Seventh and eighth graders solve and complete three various types of problems. First, they find the median rate using the box-and-whisker plot shown. Then, learners describe the inter-quartile range. In addition, they determine whether...
Curated OER
How Tall is the Average 6th Grader?
Upper grade and middle schoolers explore mathematics by participating in a measuring activity. They hypothesize on what the average height of a male or female 6th grader is and identify ways to find the average mathematically. Learners...
Curated OER
Investigation - How Tall is the Average Sixth Grader?
Pupils will measure each other and record the data in inches. They will use a stem and leaf plot to display data and figure out the average height of the students in a class. The other statistical data will be collected like the mode and...
Curated OER
Statistics with M&Ms
Seventh graders explore estimation, measurement, and probability. Students conduct surveys and create charts & graphs. They study the history of chocolate. Students design their own magazine advertisement or create a script for a...
Curated OER
What Are Your Favorite Apples?
In this tally worksheet, students take a survey to determine the favorite apple. They write tally marks beside the apple chosen. For elementary students, this worksheet may be used for counting purposes and to reinforce what a tally mark...
Curated OER
Introduction to Statistics: Mean, Median, and Mode
Students explore the concepts of mean, median, and mode. They develop an understanding and familiarity with these concepts. Students explore mean and median in an efficient way. Students explore three different measures of center.


