Curated OER
Tracking Speed
Students calculate the speed of an object, by measuring the amount of time it takes to cover a given distance, and then divide: speed=distance/time. However, the object may not have been moving at a constant rate over the given distance....
University of Colorado
Spacecraft Speed
Space shuttles traveled around Earth at a speed of 17,500 miles per hour, way faster than trains, planes, or automobiles travel! In the 13th installment of 22, groups graph different speeds to show how quickly spacecraft move through...
Curated OER
Speed
Students explore speed by calculating the average speed of several snowmobiles, and predicting which of them is the fastest. They watch a race to verify their calculations.
Curated OER
Linear Motion: Speed, Velocity & Acceleration
Learners explore the concept of linear motion. In this linear motion lesson, students calculate distance and time in order to calculate average speed and velocity in the provided problems.
Curated OER
Motion: Speed, Velocity, Acceleration and Networking
Students interpret a variety of motion graphs. In this physics lesson, students calculate the speed and acceleration of objects using numerical data from graphs. They apply what they have learned to solve real world problems.
Curated OER
Speeding By The Numbers
Learners determine speed by running or walking a given distance and dividing the distance by the time it took them to do so. They record their average speed and compare it with the speeds of other moving objects.
Curated OER
Indy 500
Start your engines! Small groups collect data from websites pertaining to the Indianapolis 500 in order to determine average speed per lap and miles in each lap. The lesson requires prior knowledge of the the formula d=rt.
Curated OER
Balsa Wood Airplane Flight and Speed Correlation
Ninth graders calculate the average speed of their balsa wood airplane. In this physics lesson, 9th graders build their own airplane and make necessary modifications to to make it fly straight. They interpret distance and time graph...
Curated OER
Domino Dash
In this speed worksheet, students use dominoes to measure the average speed of rows falling over. Students make a line graph to show the relationship between the length of the domino row and the time. Students answer 8 questions about...
Curated OER
Straight Line Motion in Two Parts
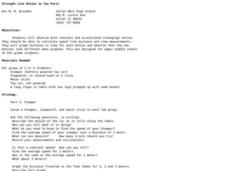
Students describe and quantify the motion of toy cars. In this motion lesson, students observe a battery powered toy car on a flat surface and a standard toy car on a sloped surface. They write their observations, measure average speeds,...
Curated OER
Linear Motion
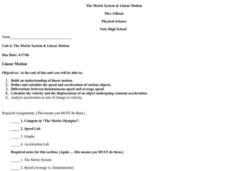
Students are able to build an understanding of linear motion. They are able to define and calculate the speed and acceleration of various objects. Students are able to differentiate betweeen instantaneous speed and average speed. They...
Curated OER
"Measurement in Motion"
Ninth graders examine the rate of motion and changes in motion using a ramp and a rolling object. They conduct the demonstration, determine the average speed, and describe how a moving object can have zero acceleration and deceleration.
Curated OER
Drive the Data Derby
Three days of race car design and driving through the classroom while guessing probability could be a third graders dream. Learn to record car speed, distances traveled, and statistics by using calculation ranges using the mean, median,...
Channel Islands Film
Island Rotation: Lesson Plan 3
How far have California's Channel islands moved? What was the rate of this movement? Class members first examine data that shows the age of the Hawaiian island chain and the average speed of the Pacific Plate. They then watch West of the...
Curated OER
Position vs. Time and Velocity vs. Time Graphs
In this constant velocity worksheet, students use data of position vs. time of a roller-skater to determine speed, acceleration, or deceleration at different points along the path. Students rank graphs according to average velocity and...
Curated OER
Find the Speed of a Protist
Pupils identify protists under a microscope, and using a stopwatch calculate the speed of a protist from a pond water sample. They use distance and time to identify the speed of a protist, and create a distance versus time graph to...
Willow Tree
Weighted Averages
Mixtures, weighted percentages, and varying speeds make problem solving difficult. The resource give learners a strategy for tackling these types of problems effectively.
Curated OER
Calculating Speed
Fourth graders complete an experiment on calculating speed. In this speed calculation lesson students complete an activity in which they have dominoes fall as slow as possible.
Curated OER
I Feel The Need For Speed
Students are introduced to the concepts of speed, velocity, acceleration and inertia. In groups, they use the internet to research rollercoasters found in the United States and calculate their acceleration rates. They use the...
EngageNY
A Critical Look at Proportional Relationships
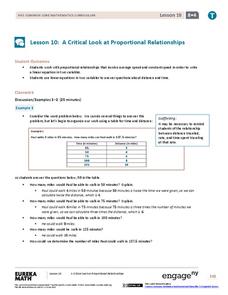
Use proportions to determine the travel distance in a given amount of time. The 10th installment in a series of 33 uses tables and descriptions to determine a person's constant speed. Using the constant speed, pupils write a linear...
Curated OER
Describing Motion-Speed
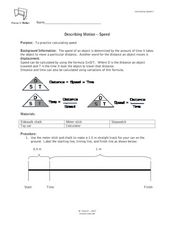
Learners study speed and learn how to calculate it. In this investigative lesson plan students participate in an activity that shows them how to calculate speed then they fill out a worksheet.
Curated OER
Horatio's Ratios
View a PBS video entitled Horatio's Drive and explore Horatio's Ratios. Collaborative learners form groups to use Mapquest to determine distances covered. They generate the mathematical averages, ratios, and rates in order to calculate...
Curated OER
Inertial Mass, Weight, and Newton's Second Law of Motion
The stage is set for you to guide future physicists through three forceful activities about motion. In the first, learners experiment with rolling carts to discover how objects interact. In the second, they inspect images of an object in...
Curated OER
Amusement Park Physics
Students conduct a series of experiments on conservation of energy and momentum. In this physics lesson, students investigate the factors affecting the period of the pendulum. They build a roller coaster and calculate the marble's...
Other popular searches
- Average Speed and Velocity
- Calculating Average Speed
- Finding Average Speed
- Average Speed Problems
- Average Speed Word Problems
- Average Speed and Distance
- Acceleration and Average Speed
- Average Speed of Cars
- Average Speed 4th
- How to Find Average Speed
- Average Speed of Volleyball
- Calculate Average Speed


