Curated OER
The U.S. Census
For this U.S. Census Worksheet, students read a passage regarding the U.S. Census and answer the following 10 multiple choice questions.
Curated OER
Using Real-Data from North Dakota to Study Place Value, Rounding, Estimation, Fractions, and Percents
In this real-data activity, learners use data from the 2008 Census Bureau to answer eight questions divided into four activities. The topics covered include: place value, rounding, estimation, fractions, and percents.
PBS
What We Do Adds Up
With so many tons of trash going into landfills each year, your environmentalists can calculate how much the average person is tossing away. This activity has a series of questions not only requiring math, but a conscious thought of how...
Curated OER
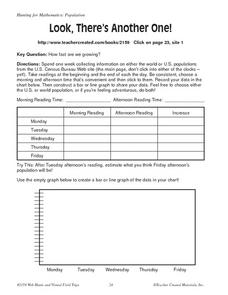
Look, There's Another One!
In this math worksheet, students spend a week collecting information on either the word or U.S. populations from the U.S. Census Bureau Web site. Students record their data in a chart and bar graph. Students also use the website to...
Curated OER
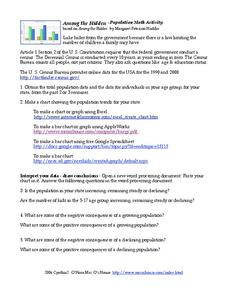
Among the Hidden - Population Math Activity
In this population worksheet, students collect data on population by researching the Census Bureau and then make online graphs and answer short answer questions about the data. Students complete 5 problems total.
Curated OER
Committing to Respect: Lessons for Students to Address Bias
Here's a guide designed to build safe, respectful learning environments, and to build understanding of the value of diversity through lessons packed with activities for specific grade levels.
Statistics Education Web
Types of Average Sampling: "Household Words" to Dwell On
Show your classes how different means can represent the same data. Individuals collect household size data and calculate the mean. Pupils learn how handling of the data influences the value of the mean.
Curated OER
How Often Do You Interact with People of Another Race or Ethnicity?
Is interacting with people from different backgrounds part of a well-rounded education? A big question awaits young readers as they explore two New York Times articles that discuss modern-day segregation, population statistics, and...
EngageNY
Comparing Distributions
Data distributions can be compared in terms of center, variability, and shape. Two exploratory challenges present data in two different displays to compare. The displays of histograms and box plots require different comparisons based...
Curated OER
Drug Sales Soar: Bar Graph
In this graphs worksheet, students analyze a bar graph that shows retail prescription drug sales in the U.S. Students complete five problem solving questions about the data on the graph.
Curated OER
Drug Sales Soar - Rate of Change
In this prescription drug worksheet, students answer short answer questions and create graphs on the sales of prescription drugs over a five year span. Students complete six questions.
Center for Innovation
Air Pollution: What's the Solution?
In this air pollution worksheet, students collect data for their county of residence as well as 10 surrounding counties including the total population and the county grade for the air. They use a map of their state and identify the 10...
Curated OER
Word Problems: "Leaving D.C."
In this solving math story problems instructional activity, students read statistics from the Student edition of USA Today to solve word problems. Students solve 6 problems.
Curated OER
Biggest US City by Letter Quiz
For this online interactive geography quiz worksheet, students respond to 26 identification questions about U.S. cities. Students have 5 minutes to complete the quiz.
Curated OER
United States Population: Using Quadratic Models
In this United States population worksheet, students solve word problems about the United States population by using the quadratic formula. Students complete 6 problems.
Curated OER
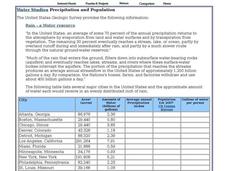
Water Studies: Precipitation and Population
In this water worksheet, students complete the chart about precipitation and population and answer short answer questions. Students complete 14 rows in the chart and answer 4 questions.
Curated OER
Breaking News English: World Population Aging At Record Rate
For this English worksheet, students read "World Population Aging At Record Rate," and then respond to 1 essay, 47 fill in the blank, 7 short answer, 20 matching, and 8 true or false questions about the selection.
Curated OER
Chapter 9: Social Stratification
In this social stratification worksheet, students answer 12 fill in blank questions and 7 multiple choice questions regarding the division of society into categories.


