Curated OER
Reading Timetable
Word problems, telling time, and reading charts all come together on this page. After reviewing a table of different travel times for a bus, a tram, a taxi, and a trolley, third graders solve word problems about arrival times and stop...
Mathed Up!
Pie Charts
Representing data is as easy as pie. Class members construct pie charts given a frequency table. Individuals then determine the size of the angles needed for each sector and interpret the size of sectors within the context of frequency....
Curated OER
Reading a Calendar
Calendars are great for so many reasons. They keep track of time, can help teach children to read charts, show numbers in sequential order, and are perfect for word problems. First graders assess three different calendars to answer 11...
Curated OER
Reading Tally Charts #2
Keep count with tally marks! First graders practice reading tally marks with this straightforward learning exercise. They work with interpreting data from a chart, as well as working with addition and subtraction under 20. A great math...
Curated OER
Reading Charts and Tables - Garden Spiders
Students complete chart and table reading activities to learn about garden spiders. In this chart and tables lesson, students view a video about garden spider varieties. Students name the different spiders and complete a spider garden...
Curated OER
Reading Charts
How well can your third graders interpret data from a chart? Use this straightforward worksheet to reinforce problem-solving skills. After reading a school schedule, pupils answer ten questions about the information in the chart. A great...
Mathed Up!
Tallys and Charts
After watching a brief instructional video, young mathematicians are put to the test. By completing and reading frequency tables, tally charts, and bar graphs, individuals show their understanding of how to interpret data.
Curated OER
Reading Tally Chart
As learners explore data analysis have them practice reading tally charts using these examples. They answer basic questions about each of three charts, employing addition and subtraction skills. For example, a chart tallying t-shirts...
Curated OER
Thanksgiving Feast (Read the Charts)
Students practice reading charts about foods country of origin. They interpret information and answer questions related to charts. They discover how food production adds to the economy.
Curated OER
My Test Book: Standard Form and Reading Tables
For this math skills worksheet, students solve 10 multiple choice math problems that require them to write numbers in standard form and read tables. Students may view the correct answers.
Math Worksheets Land
Reading and Making Pie Graphs Worksheets
The opportunities are endless with a collection of five worksheets that enable young mathematicians to read pie graphs. Individuals use graphs to answer eight multiple choice questions on each sheet. The set of five allows for continued...
Curated OER
Timetable Problems
Learning how to read a schedule and determine when you will depart and arrive is an everyday skill that builds competency in chart reading, subtraction, elapsed time, and counting on. Learners discuss how to solve timetable problems and...
Alabama Learning Exchange
Wheels All Around
Budding mathematicians explore the concept of skip counting. They practice skip counting as they use it to determine the number of wheels that come to school at 3 different times throughout the day. They also create a data graph to show...
Curated OER
Pies and Percentages--Learning About Pie Graphs
In this pie graph worksheet, students draw a pie graph for the zookeeper with the data he collected, choose a different color for each animal species and make a key to the graph.
Curated OER
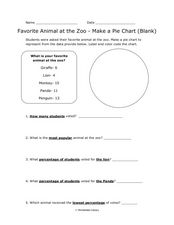
Pie Chart: Favorite Animal at the Zoo
In these three interpreting a pie chart and answering questions worksheets, students use the data provided to label and color code the blank and outlined pie charts, read and interpret a completed pie chart, and then answer questions...
Curated OER
My Test Book: Reading Pie Charts
In this math skills worksheet, students solve 9 multiple choice math problems that require them to read and interpret charts. Students may view the correct answers.
Balanced Assessment
Movie Survey
Movie preferences will get your classes talking! Individuals read a pie graph and construct a bar graph using the same information. They then answer questions specific to the data and sample size.
Beyond Benign
Municipal Waste Generation
Statistically, waste may become a problem in the future if people do not take action. Using their knowledge of statistics and data representation, pupils take a look at the idea of waste generation. The four-part unit has class members...
Curated OER
Reading Bar Charts
Help kids understand how to collect data through surveys, organize data in a bar chart, then analyze their findings. There are three different surveys for learners to conduct, a full description of all the parts of a bar chart, and three...
Curated OER
Using Graphs and Charts
Students complete T charts and manipulate numbers using graphs and charts. In this math graphs and charts lesson, students review the concepts of pattern and function. Students then complete practice pages where they manipulate numbers...
Curated OER
A Data Processing Lesson for Statistics -- Reading a Table or Chart
Students identify the structure and key parts of tables and charts. They determine which data is meanjngful and make comparisons with the data. They describe the scope of the AIDS plague throughout the world.
Curated OER
Charts and Graphs
In this charts and graphs worksheet, students refer to charts and graphs to solve word problems. Students complete 10 multiple choice word problems.
Curated OER
Meter Reading Using Place Value
Fourth graders watch a video about reading a gas meter and discuss what they saw in the clip. In this place value lesson, 4th graders complete a worksheet where they fill in the missing dials on the meters.
Curated OER
Solving Multi-Step Problems
Use this multi-step problems worksheet to have your charges complete multi-step problems including money, fractions, charts, and more. They complete 30 problems total.
Other popular searches
- Reading Charts and Graphs
- Active Reading Charts
- Kwl Charts and Reading
- Reading Charts and Diagrams
- Kl Charts and Reading
- Reading Charts and Tables
- Criteria Charts in Reading
- Reading Charts or Diagrams
- Plot Charts for Reading
- Data Charts Reading
- Reading Charts Wind
- Math Reading Charts


