Curated OER
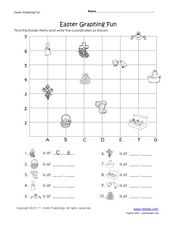
Easter Graphing Fun
Graphing can be festive! This Easter worksheet has scholars using coordinates to record the location of ten holiday images. The first is done for them, and the grid is large and appealing to younger learners. Consider visualizing this...
Curated OER
Where Did the Bunny Leave the Eggs? Picture Graphing Activity
The Easter Bunny left us a bunch of eggs, but how many did he leave? Learners use the data to create a picture graph, interpret it, and answer the questions that follow. There's even easy egg cut-outs for your youngsters!
Curated OER
Holiday Greeting Cards: A Graphing Activity
Learners examine statistics about the popular type of greeting cards and create pie or bar chart using an online tool. They illustrate the sales statistics for the greeting cards before making the charts.
Curated OER
THE EASTER BUNNY GETS READY! PICTURE GRAPH
For this graphing worksheet, learners read a picture graph about colors of Easter eggs and then answer questions about the graph.
Curated OER
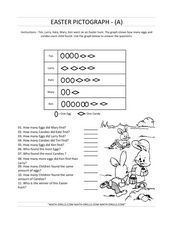
Easter Pictograph
In this pictograph activity, students look at the Easter pictograph and solve problems based on the graph. Students complete 10 problems.
Curated OER
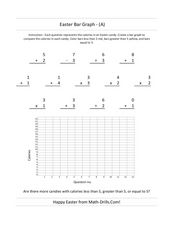
Easter Bar Graph- A
For this Easter math worksheet, students first solve 13 problems with addition, subtraction, multiplication and division. Using the answers, students make a bar graph.
Curated OER
Easter Bar Graph - (E)
In this math review worksheet, students complete addition, multiplication, division, and subtraction problems where each answer is put into an Easter bar graph. Students complete 13 problems.
Curated OER
Easter Bar Graph - (D)
In this math review activity, students complete addition, multiplication, division, and subtraction problems where each answer is put into an Easter bar graph. Students complete 13 problems.
Curated OER
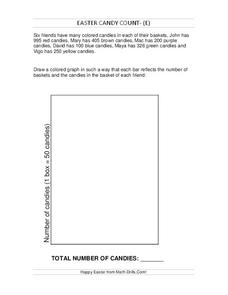
Easter Candy Count
In this bar graph worksheet, students fill in the bar graph based on the information about Easter candy that each child got. Students complete 6 spaces in the bar graph and find the total number of candies.
Curated OER
Easter Candy Count
For this bar graph worksheet, students complete a bar graph based on the information of Easter candy they are given for each color. Students complete 6 spaces in the bar graph and find the total.
Curated OER
Easter Bar Graph - (B)
In this math review worksheet, learners complete addition, subtraction, multiplication, and division problems and put their answers into a bar graph that represents calories. Students complete 13 problems and 1 graph.
Curated OER
Easter Candy Count
In this bar graph worksheet, students complete a bar graph based on the information of Easter candy they are given for each color. Students complete 6 spaces in the bar graph and find the total.
Curated OER
Easter Bar Graph - C
In this math review worksheet, students complete addition, multiplication, division, and subtraction problems where each answer is inserted into a bar graph. Students complete 13 problems.
Curated OER
Easter Candy Count
In this bar graph worksheet, students fill in the bar graph with the information of Easter candy that each child has and find the total. Students fill in 6 bars in the bar graph.
Curated OER
Easter Candy Count
In this bar graph activity, students complete a bar graph based on the information of Easter candy they are given for each color. Students complete 6 spaces in the bar graph and find the total.
T. Smith Publishing
Easter Graphing Worksheet
A large graph takes up most of this worksheet. On it are Easter-themed icons for which learners must identify and write down the coordinates for. Note that there are religious symbols included in the icons which would not make this...
Curated OER
The Egg Hunt- Using a Graph to Answer Data Questions
For this pictograph worksheet, students answer questions based on a pictograph that shows colored Easter eggs. They follow the key that shows that each egg picture is equal to 10 eggs. They fill in the blanks with answers to how many,...
Curated OER
Easter Egg Pictograph
In this pictograph worksheet, students use a given graph to answer questions about Easter eggs found by children and answer related questions. A website reference for additional resources is given.
Yummy Math
US Holiday Candy Sales
Candy is a big business! Calculate the amount of money consumers spent on major holidays—Easter, Halloween, Christmas, Hanukkah, and Valentine's Day—based on the total amount of candy sales from 2011 and the percentage of each holiday's...
Curated OER
Baster Bonnets Sold
In this graphing worksheet, students look at a bar graph and answer questions. Students review a graph showing the number of Easter bonnets sold by color and number. Students then answer five questions about the graph. Students become...
Curated OER
Bunny Mix M&M's Math
In this Easter M&M's math activity worksheet, students count their M&M's, sort them by color, make a pattern with them, and create a graph showing how many of each color they have.
Curated OER
Jelly Bean Math
In this Easter math activity, 1st graders work with a handful of jelly beans. Students sort the jelly beans by color and color in one block of the color graph per jelly bean.
Curated OER
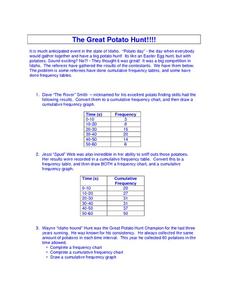
The Great Potato Hunt
In this science activity, students examine the data from the potato hunt where potatoes are found like Easter Eggs. The data of the number of potatoes found is recorded in the frequency tables.
Curated OER
Questionnaires and Analysis
In this questionnaires and analysis worksheet, students design a questionnaire and then select a sample. They organize and analyze data. This four-page worksheet contains 1 multi-step problem. Explanations and examples are provided.
Other popular searches
- Graphing Easter Eggs
- Easter Graphing Projects
- Easter Graphic Organizers
- Easter Graph Worksheets
- Graphing Easter Bunny


