Concord Consortium
Graphical Depictions
Parent functions and their combinations create unique graphical designs. Learners explore these relationships with a progressive approach. Beginning with linear equations and inequalities and progressing to more complex functions,...
Curated OER
Graphical Analysis
Get out your TI-nspire graphing calculator and explore polynomials. Learners determine where a given polynomial are increasing or decreasing, find maximums, minimums, and zeros of polynomials, and discuss end behavior of polynomials....
Concord Consortium
Graphing Elements
How do you graph a sentence? Scholars do just that as they represent relationships between independent and dependent variables with a graphical representation. Given a sentence, they determine the pertinent relationship and create a...
Mathematics Assessment Project
Representing Quadratic Functions Graphically
Sometimes being different is an advantage. An engaging activity has scholars match cards with quadratic functions in various forms. Along the way, they learn about how each form highlights key features of quadratic functions.
Curated OER
Complex Analysis: Graphical Representations
In this graphical representation worksheet, students draw an Argand diagram depicting two complex numbers in a complex plane. They draw vectors to represent complex numbers. This two-page worksheet contains five equations to solve.
Curated OER
Complex Analysis: Graphical Representations
In this graphical representation worksheet, students draw an Argand diagram depicting complex numbers. They draw in vectors that represent complex numbers. This three-page worksheet contains approximately ten problems.
Curated OER
Linear Systems: Graphical Interpretation of Vectors
In this graphical interpretation of vectors worksheet, students explore the geometrical appearance of given problems, determine if vector subtraction is commutative and graph a system of equations. This three-page worksheet contains...
Curated OER
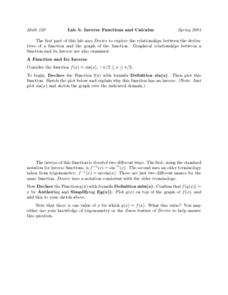
Lab 5: Inverse Functions and Calculus
Learners identify graphical relationships between a function and its inverse using a graphing calculator. They begin by declaring the function f(x) with formula definition sin(x), then plot this function. To finishing the lab, they check...
Modesto Junior College
Graphical Transformations of Functions
Transform your knowledge from average to excellent with this comprehensive guide to function transformations. All of the types of shifts, stretches, and reflections are included with an explanation and coordinating graph to show...
Texas Instruments
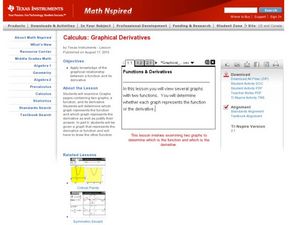
Graphical Derivatives
Pupils solve functions using the derivative. They determine the derivative of a function based on its graph, then analyze different functions and draw a relationship and conclusion based on the graph.
Virginia Department of Education
Radical Equations
Provide students with the skill for how to examine algebraic and graphical approaches to solving radical equations. Learners solve various radical equations involving square root and cube root expressions. They first solve using...
EngageNY
Graphing Systems of Equations
Expand on learners' understanding of quadratic-linear systems. Building on the graphic understanding developed in the previous lesson, pupils learn algebraic methods of solving the systems.
EngageNY
Vectors in the Coordinate Plane
Examine the meaning and purpose of vectors. Use the lesson to teach your classes how find the magnitude of a vector and what it represents graphically. Your pupils will also combine vectors to find a resultant vector and interpret its...
Mathed Up!
Solving Simultaneous Equations Graphically
The solution resides at the intersection. Pupils use a short instructional activity to review the process of solving a system of linear equations using graphing. The instructional activity provides completed graphs for most of the items,...
Mathematics Assessment Project
Representing Inequalities Graphically
A new, improved version of the game Battleship? Learners graph linear inequalities on the coordinate plane, then participate in a game where they have to guess coordinate points based on the solution to a system of linear inequalities in...
Curated OER
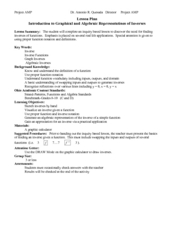
Introduction to Graphical and Algebraic Inverses
Solve inverse functions through graphing and algebra. High schoolers will graph inverse functions and use the correct notation to write the equation. They observe a graph and write an equation for the function. In the end, they will be...
EngageNY
Directed Line Segments and Vectors
Investigate the components of vectors and vector addition through geometric representations. Pupils learn the parallelogram rule for adding vectors and demonstrate their understanding graphically. They utilize the correct notation and...
K20 LEARN
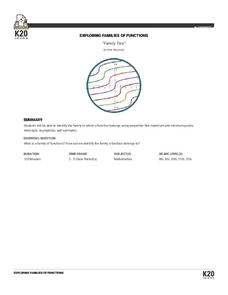
Family Ties: Exploring Families OF Functions
They say it runs in the family. Small groups use a card sorting activity to group graphs of functions into families. After grouping by families, the class develops conclusions for parent functions and create a graphic organizer.
Willow Tree
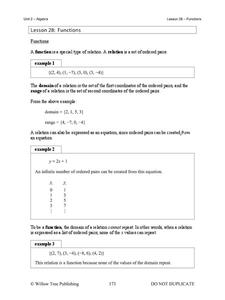
Functions
What makes a function a function? Learn the criteria for a relation defined as a function both numerically and graphically. Once young mathematicians define a function, they use function notation to evaluate it.
EngageNY
Bacteria and Exponential Growth
It's scary how fast bacteria can grow — exponentially. Class members solve exponential equations, including those modeling bacteria and population growth. Lesson emphasizes numerical approaches rather than graphical or algebraic.
Mathematics Vision Project
Module 1: Functions and Their Inverses
Nothing better than the original! Help your class understand the relationship of an inverse function to its original function. Learners study the connection between the original function and its inverse through algebraic properties,...
EngageNY
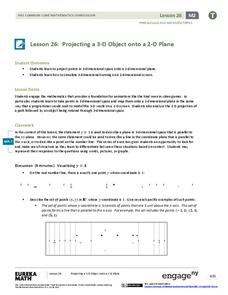
Projecting a 3-D Object onto a 2-D Plane
Teach how graphic designers can use mathematics to represent three-dimensional movement on a two-dimensional television surface. Pupils use matrices, vectors, and transformations to model rotational movement. Their exploration involves...
Balanced Assessment
Toilet Graph
Mathematics can model just about anything—so why not simulate the height of water in a toilet bowl? The lesson asks pupils to create a graphical model to describe the relationship of the height of the water as it empties and fills again....
CK-12 Foundation
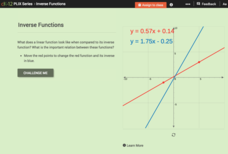
Inverse Functions
Provide a graphical view of inverses. Pupils manipulate points on a line and see the relationship of the graph with the graph of its inverse. Using the relationship between the graphs, scholars respond to questions concerning inverses...
Other popular searches
- Describe Graphically
- Adding Vectors Graphically
- Solving Systems Graphically
- Finding Slope Graphically
- Slope Graphically
- Transformations Graphically
- Solve System Graphically


