US Census Bureau
Us Census Bureau: International Data Base
Statistical data on the population and demographics of 228 countries, including change, sex ratios, life expectancy, and percent with HIV/AIDS. There are also detailed explanations of the means of producing these statistics. It is...
Texas Education Agency
Texas Gateway: Collecting Data and Making Predictions
Given an experimental situation, the student will write linear functions that provide a reasonable fit to data to estimate the solutions and make predictions.
Texas Education Agency
Texas Gateway: Predicting, Finding, and Justifying Data From a Graph
Given data in the form of a graph, the student will use the graph to interpret solutions to problems.
Texas Instruments
Texas Instruments: Boat Registration and Manatee Deaths in Florida
Students will explore the data on boat registrations and manatee deaths in Florida. They will use the data, the graph of the data and the line of best fit to make predictions about the relationship of the data.
Texas Education Agency
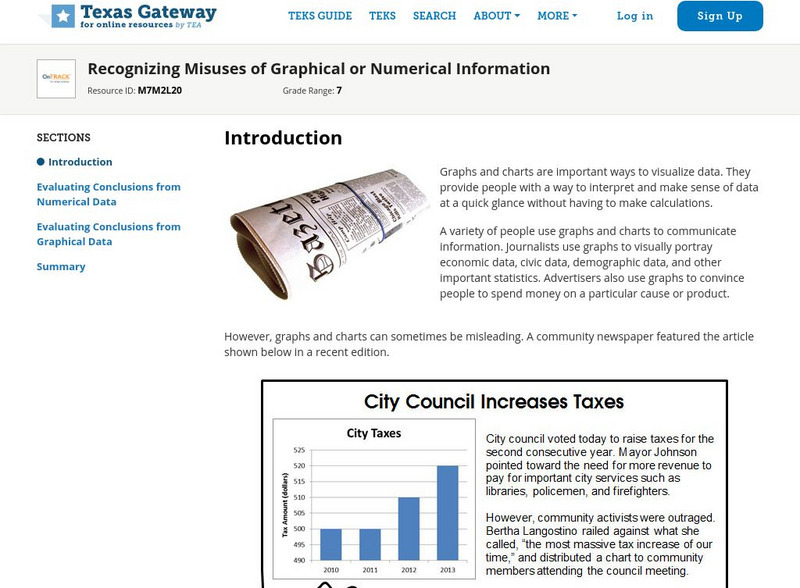
Texas Gateway: Recognizing Misuses of Graphical or Numerical Information
Given a problem situation, the student will analyze data presented in graphical or tabular form by evaluating the predictions and conclusions based on the information given.
Other
Bscs: Budburst Lilac Festival
In this self-directed activity, students use graphs and maps of lilac phenology data to determine the best time to host a lilac blossom festival in their area. A handout with everything the student needs to complete this lesson is...
Texas Instruments
Texas Instruments: Election Night With Percent
The students will be working primarily with the concept of % of a number. They will calculate the number of people expected to vote when given the population and % of registered voters along with historical data on percentage of voter...


