Curated OER
How Small is It?
High schoolers better understand what a concentration of one part per million means through activities. Students discuss "Maximum Contaminant Level" of a toxic in the water. They measure the classroom to find out how many cubic...
Curated OER
Parts Per Million
Students perform serial dilution of food coloring experiment with partner, examine concentration levels, and differentiate parts per million (PPM) and parts per billion (PPB). Students complete pre-lab and post-lab questions and data table.
Curated OER
Calculating Parts per Million: Do We Have a Problem Here?
Students calculate ppm and ppb by using unit analysis when given a ratio of amounts.
They determine in ppm what constitutes a health risk for a particular toxin given data
and whether local health officials should close a lake...
Curated OER
Industrialization, Chemicals and Human Health - Math
Students review the units of the metric system, and practice estimating measures before actually converting between the two systems of measurement. They participate in activities to visualize a concentration of one part per million....
Curated OER
The Numbers Game
Students examine how to calculate the part-per-million and part-per-billion units used to measure contaminant concentrations in the environment. They calculate ratios, take a quiz, analyze a sample chemical spill, and determine if...
Curated OER
Fertilizers, Pesticides and Health
Young scholars apply real data to create and calculate algebraic equations. Students create a visual to represent the concentration for one part per million and apply unit analysis to verify measurement computations. Young scholars...
Curated OER
Carbon Dioxide Increases
In this atmospheric carbon dioxide worksheet, students use a graph of the Keeling Curve showing the increase in atmospheric carbon dioxide since 1958 to solve 6 problems. They determine the rate of increase, the find the percentage of...
Curated OER
Modeling the Keeling Curve with Excel
In this modeling the Keeling Curve worksheet, learners use given data beginning in 1960 to create a mathematical model for the changes in atmospheric carbon dioxide over time. Students manipulate the equation to predict the carbon...
Curated OER
Math and Climate Worksheet
In this math and climate worksheet, students complete a set of 10 word problems, all related to math and climate. A reference web site is given for additional activities.
Curated OER
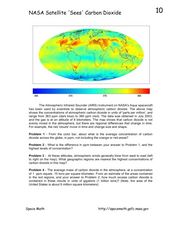
NASA Satellite 'Sees' Carbon Dioxide
In this atmospheric carbon dioxide worksheet, students observe a map showing the concentrations of atmospheric carbon dioxide taken by the Atmospheric Infrared Sounder instrument. Students solve 4 problems using the map. They determine...


