Curated OER
Using Vegetation, Precipitation, and Surface Temperature to Study Climate Zones
Using NASA's Live Access Server, earth scientists compare the temperature, precipitation, and normalized difference vegetation index for four different locations. They use the data to identify the climate zone of each location using...
PBS
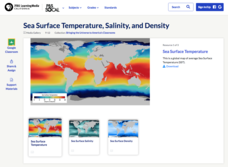
Sea Surface Temperature, Salinity, and Density
Earth's vast ocean is full of mysteries! Science scholars discover the big-picture properties that influence its characteristics at different latitudes using a lesson from PBS's Weather and Climate series. After completing a background...
National Academy of Sciences
CO2 and Temperature
Scientists can model global surface temperature with and without considering human emissions, but does do these factors really make a difference? Two interactive graphs demonstrate some factors that affect climate change. The first graph...
Curated OER
Linkages Between Surface Temperature and Tropospheric Ozone
Young scholars use data microsets of mean near-surface air temperature and tropospheric ozone residual averages to infer patterns. Students analyze changes in tropospheric ozone and then hypothesize about the consequences of these changes.
Curated OER
Ocean Currents and Sea Surface Temperature
Students use satellite data to explore sea surface temperature. They explore the relationship between the rotation of the Earth, the path of ocean current and air pressure centers. After studying maps of sea surface temperature and ocean...
Curated OER
Star Types-Color and Surface Temperature
In this types of stars activity, students complete a table with the color and star type for 17 stars. They are given their luminosity and surface temperature along with a chart that has characteristics of stars to use as reference.
NASA
Analyzing Surface Air Temperatures by Latitude: Student Activity
Explore global temperatures from the comfort of your learning place! Meteorologists analyze surface temperatures and anomalies across different latitudes. Investigators evaluate graphs to find temperature differences and answer questions...
Curated OER
A Comparison of Land and Water Temperature
Young scholars examine NASA satellite observations of surface temperature and investigate the seasonal changes of land and water temperature.
NOAA
Graphing Temperatures
Battle of the hemispheres? In the fourth installment of a five-part series, young oceanographers use the NOAA website to collect temperature data from drifters (buoys), one in the Northern Hemisphere and one in the Southern Hemisphere....
Curated OER
Differences Between Ground and Air Temperatures
Students examine the differences between air temperature and ground temperature. In this investigative lesson students find NASA data on the Internet and use it to create a graph.
Curated OER
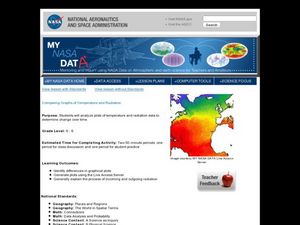
Comparing Graphs of Temperature and Radiation
Young scholars study plots and use a Live Access Server to generate plots. In this temperature instructional activity students examine the process of incoming and outgoing radiation.
Curated OER
Surface Area and Volume
Upper graders identify the surface area and attributes of figures that are measurable. They estimate, measure, and record perimeter, area, temperature change, and elapsed time, using a variety of strategies. They also determine the...
Curated OER
Using Vegetation, Precipitation, and Surface Temperature to Study Climate Zones
Students begin their examination of the climate zones found around the world. Using a software program, they identify the relationship between the vegetation, climate and temperatures of the different zones. They also plot coordinates...
Curated OER
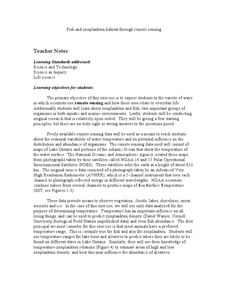
Fish and Zooplankton Through Remote Sensing
Ecology aces examine sea surface temperature maps and relate temperatures to concentration in fish and zooplankton populations. Take your class to a computer lab and provide experience with actual remote sensing data. Some of the links...
Curated OER
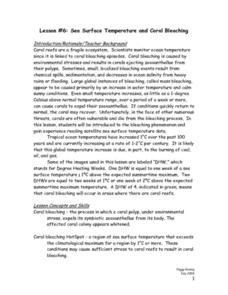
Lesson #6: Sea Surface Temperature and Coral Bleaching
Fifth graders examine the concept of coral bleaching and sea surface temperature. They view a teacher demonstration, interpret sea surface temperature data, explore a website, and complete worksheets.
Curated OER
The Solstices
Compare surface temperatures when the solstice occurs in the different hemispheres. Young scientists draw conclusions from their investigation of data collected using spreadsheets and a globe.
Curated OER
Creating Climographs
Middle schoolers use satellite data to compare precipitation and surface temperatures on different islands. In this satellite lesson students create graphs and explain the differences between weather and climate.
University of Waikato
Water Temperature
Water temperatures connect to the movement of the ocean. Pupils read two articles about the temperature and the motion of the oceans before small groups investigate the interaction of hot and cold water. Team members add cold and hot...
NASA
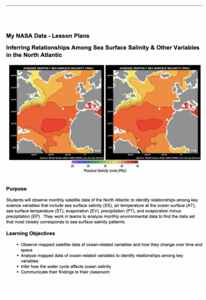
Inferring Relationships Among Sea Surface Salinity & Other Variables in the North Atlantic
Some say a picture is worth a thousand words—even from a hundred miles away! Learners review satellite data to analyze ocean variables such as temperature, salinity, evaporation, and precipitation. They look for patterns in the data and...
Curated OER
The Role of the Atmosphere and Greenhouse Effect in Determining the Surface Temperature of the Earth
Students complete research and solve problems that show the factors that determine the temperature of the earth's surface including the effect of greenhouse gases. They look at the relationships between solar energy, atmosphere, and how...
NASA
Air Temperatures Around the World: Student Activity
Check out climate anomalies just like NASA climatologists! Investigators use a GISTEMP map from NASA to analyze one month of climate anomalies. Scientists look for data extremes and generate possible explanations for observable patterns.
Center Science Education
Looking Into Surface Albedo
How does the color of a surface affect the heating of the earth? Middle school science classes experiment with color and surface albedo to determine the relationship. The website has tabs for an overview, teacher's instructions,...
PBS
Ocean Circulation in the North Atlantic
Swirling and churning, the waters of the North Atlantic play a vital role in Earth's climate! Discover the many factors that produce circulation using a multimedia lesson from PBS's Weather and Climate series for high schoolers. Scholars...
NOAA
Ground-truthing Satellite Imagery with Drifting Buoy Data
Ground-truthing ... is it even a word? The last installment of a five-part series analyzes how scientists collect sea surface temperature data. Scholars use government websites to compare temperature data collected directly from buoys...
Other popular searches
- Sea Surface Temperature
- Surface Temperature Change
- Compare Surface Temperature
- Urban Surface Temperature
- Gulf Surface Temperature
- Surface Temperature Effects
- Measure Surface Temperature


