Curated OER
Standard of Living: Data Handling Investigation
In this European standard of living worksheet, students use their research and analytical skills to respond to this hypothesis: The standard of living in the Northern European Countries is far higher than that in the Southern European...
Curated OER
Word Snake: Data
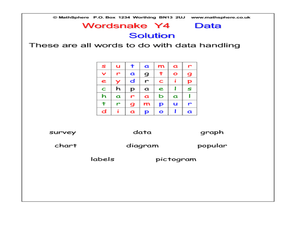
In this data worksheet, students search for words in a word snake, which works like a maze, for words that represent data. Students search for 8 words.
Curated OER
Wordsnake: Data
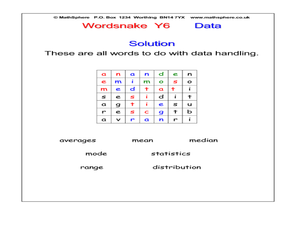
In this data words worksheet, students search for data words in a wordsnake which looks like a word search. Students look for 7 words.
Curated OER
ESL Holiday Lessons: Data Protection Day
In this language skills worksheet, students read an article about Data Protection Day. Students respond to 6 matching questions, 29 fill in the blank questions, 30 multiple choice questions, 12 word scramble questions, 30...
Bowland
Water Availability
Just how scarce is water in different parts of the world? Through these water lessons, young data analysts use provided data to investigate the scarcity of water in countries of the Middle East and Africa. They use ratios and rates to...
Bowland
Speed Cameras
Do speed cameras help reduce accidents? Scholars investigate this question using a series of spreadsheet activities. Along the way, they learn about randomness, probability, and statistical analysis.
Curated OER
Handling Data: Collecting and Recording Data
Young scholars collect and record data. In this collecting and recording data lesson, students collect data and record that data using frequency tables which include the x and y axis.
Curated OER
Handling Data: measure of Average
Fifth graders analyze data from a simple table. In this graphing lesson, 5th graders compare distributions. Students recognize that the mean helps them find the formula. Students answer questions on the mean, median, and range.
Polar Trec
Permafrost Thaw Depth and Ground Cover
The thaw depth of tundra creates a positive feedback loop with both global warming and the carbon cycle. Scholars sort photos and develop a hypothesis for ground cover and permafrost depth. Then they review the data and measurements...
Curated OER
Bounce With Me
How many practice lay-ups do you think Michael Jordan has done in his lifetime? Too many to count, but he had to start somewhere! Practice is the key to getting better in any activity. Look through this basketball lesson as there are...
Towson University
Case of the Crown Jewels
Can your biology class crack the Case of the Crown Jewels? Junior forensics experts try their hands at DNA restriction analysis in an exciting lab activity. The lesson introduces the concept of restriction analysis, teaches pipetting and...
Curated OER
Can You Bag It?
Put your class's observational skills to the test with a science experiment about paper and plastic bags. After reading some background knowledge about the materials in plastic grocery bags, third graders interpret a chart to answer a...
Teach Engineering
Insulation Materials Investigation
Don't melt away! Pairs investigate different insulation materials to determine which one is better than the others. Using a low-temp heat plate, the teams insulate an ice cube from the heat source with a variety of substances. They...
Curated OER
Maps and Lines
In these organizing data worksheets, 5th graders complete four worksheets of activities that help them learn maps, graphs, and lines. Students then study images of maps, lines, and graphs.
Curated OER
Tally Chart: Favorite Names
In this data display learning exercise, students analyze a tally chart of favorite hamster names. Using the information on the chart, students solve 8 word problems.
Actis
Handling Data: Probability, Tree Diagrams
Clean, but captivating, two online simulations demonstrate probability for middle schoolers. They can choose the number of coins and tosses and watch as the results pile up. They can choose from a variety of spinner types and the number...
Curated OER
Dough Lake Topology
High schoolers practice coordinates and measurements, develop 2D, 3D topological map, construct grid with string on real surface, establish "level" fixed point for measurements, take and record data points of elevation, and enter data on...
Curated OER
What is a Box and Whisker Plot?
Eighth graders explore the correct use of box and whisker plors. The times when they are appropriate to use to compare data is covered. They plot data according to statistical analysis including mean, median, and mode.
NASA
Discovering Some of Your “Yardsticks” Are Actually “Meter-sticks”
The Milky Way gets great reviews on Trip Advisor — 100 million stars. The activity allows scholars to rethink their assumptions and prior knowledge. Pupils observe a set of two lights at equal distance and brightness, but they believe...
Curated OER
Handling Data: Coin Tossing Simulation
Learners collect experimental data and record it on a frequency table. After accessing an Internet coin toss simulation site they discover that repetition of an experiment may result in different outcomes. They identify the mutually...
Curated OER
Handling Data- Health Statistics
In this social studies worksheet, students organize 50 country cards into groups. Students analyze a chart and group countries according to lowest, middle, and highest Infant Mortality Rate.
Curated OER
Lesson 9: Tracking Commodities
Over the corse of a month, small groups will monitor the price of a specific energy commodity and analyze it in relation to global and domestic events. They play a trade simulation game and create infographics showing what they've...
American Physiological Society
Drug the Water Flea
This is a flea. This is a flea on drugs. Any questions? Your class will have questions aplenty during an impactful experiment. Lab groups get to know Daphnia magna, the humble water flea, and study the effects of stimulants and...
American Chemical Society
Evaporation
This is one in several lessons that explore the relationship between temperature and phase changes of water. After some discussion, elementary physical scientists place wet paper toweling on a hot and a room-temperature water bag and...
Other popular searches
- Numeracy Data Handling
- Data Handling Year 4
- Data Handling Math
- Graphs and Data Handling
- Data Handling Projects
- Maths Data Handling
- Graphs Data Handling
- Data Handling Ear 4
- Block Graphs Data Handling
- Handling Data
- Data Handling Ice Cream
- Data Handling Lesson Plan


