North Carolina State University
Exploring Genetics Across the Middle School Science and Math Curricula
Where is a geneticist's favorite place to swim? A gene pool. Young geneticists complete hands-on activities, experiments, and real-world problem solving throughout the unit. With extra focus on dominant and recessive genes, Punnett...
Curated OER
“I Can” Common Core! 6th Grade Math
Help your sixth graders reach their Common Core math standards by providing them with a checklist of "I can" statements for each standard. As each concept is covered, kids can check it off, as long as they can do what it states.
National Research Center for Career and Technical Education
Information Technology: Photoshop Scale
Scaling is a practical skill as well as a topic to be addressed throughout the Common Core math standards. You are given three different presentations and a detailed teacher's guide to use while teaching proportion, as well as practice...
Mathematics Assessment Project
Mean, Median, Mode, and Range
What a find! Here is a instructional activity, designed to meet sixth grade math Common Core standards, that focuses on the calculation of different measures of center for the scores from a penalty shoot-out competition. An independent...
American Statistical Association
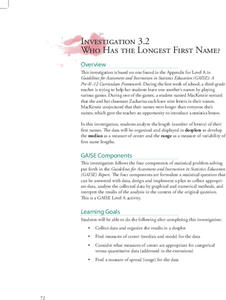
Who Has the Longest First Name?
Name that statistic! Classmates each write their name and the number of letters in it on a sticky note to place on the board. As a class, they determine the median, mode, and range of the name lengths, and create a dot plot of the data....
American Statistical Association
The Mean and Variability from the Mean
Discover the mean from fair share to the balance point. The lesson takes small groups of pupils through two different interpretations of the mean, the fair share understanding of the mean, and the balance point. Scholars use the...
Workforce Solutions
Miniature Gulf Coast Project
Scholars show what they know about data collection and analysis with an activity that examines a smaller population of Houghton, Texas. Independently or in pairs, learners identify their research question, gather, graph, and analyze...
Utah Education Network (UEN)
Statistics
Find the value in analyzing data values. Statistics is the focus in the fifth of seven installments of the 6th Grade Math series. Individuals learn to examine dot plots, histograms, and box plots by considering the shape, mean, median,...
CK-12 Foundation
CK-12 Middle School Math Concepts - Grade 6
Twelve chapters cover a multitude of math concepts found in the Common Core standards for sixth grade. Each title provides a brief explanation of what you will find inside the chapter—concepts from which you can click on and learn more...
National Museum of Mathematics
Hands-On Data Analysis
Jump at the chance to use this resource. A kinesthetic activity has classmates jumping in several different ways (standing, single-step, and multiple-step jumps) to create handprints on poster paper taped to the wall. They measure the...
PHET
Plinko Probability
It's a good thing the resource dropped into your radar. Young mathematicians use an app that randomly drops balls through a Plinko game and into bins. They compare the distribution to that of an ideal binomial distribution.
CCSS Math Activities
Smarter Balanced Sample Items: 6th Grade Math – Target I
Scholars apply their knowledge of statistical questions to determine which questions meet the criteria. Grade 6 Claim 1 Item Slide Shows offers a couple of practice problems for scholars to discuss.
American Statistical Association
How Random Is the iPod’s Shuffle?
Shuffle the resource into your instructional activity repertoire. Scholars use randomly-generated iPod Shuffle playlists to develop ideas about randomness. They use a new set of playlists to confirm their ideas, and then decide whether...
Mascil Project
Epidemics: Modelling with Mathematics
The Black Death epidemic is responsible for more than one million deaths in the United Kingdom. An inquiry-based activity has young scholars explore the rate of disease spread. They then analyze graphs showing data from epidemics such as...
American Statistical Association
Armspans
Young mathematicians collect data on the arm spans of classmates. Then they sort the data by measures of center, spread, and standard deviation. Finally, they compare groups, such as boys and girls, to interpret any differences.
Shodor Education Foundation
Skew Distribution
Slide the class into a skewed view. Learners alter the location of the median relative to the mean of a normal curve to create a skew distribution. They compare the curve to a histogram distribution with the same skewness.
Shodor Education Foundation
Plop It!
Build upon and stack up data to get the complete picture. Using the applet, pupils build bar graphs. As the bar graph builds, the interactive graphically displays the mean, median, and mode. Learners finish by exploring the changes in...
EngageNY
Describing the Center of a Distribution Using the Median
Find the point that splits the data. The lesson presents to scholars the definition of the median through a teacher-led discussion. The pupils use data lists and dot plots to determine the median in sets with even and odd number of data...
EngageNY
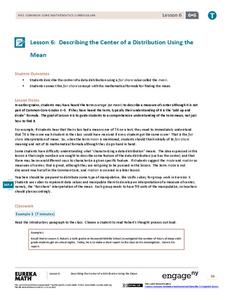
Describing the Center of a Distribution Using the Mean
Everyone does their fair share. The sixth segment in a 22-part unit presents the mean as a fair share. Groups build a conceptual understanding of the mean of a data set, rather than simply learn an algorithm. Learners use the...
EngageNY
Displaying a Data Distribution
Pupils analyze a display of data and review dot plots to make general observations about the highest, lowest, common, and the center of the data. To finish, learners match dot plots to scenarios.
NOAA
What Killed the Seeds?
Can a coral cure cancer? Take seventh and eighth grade science sleuths to the underwater drugstore for an investigation into emerging pharmaceutical research. The fifth installment in a series of six has classmates research the wealth of...
Noyce Foundation
Through the Grapevine
Teach statistics by analyzing raisins. A thorough activity provides lesson resources for five levels to include all grades. Younger pupils work on counting and estimation, mid-level learners build on their understanding of the measures...
Curated OER
NFL Home Field Advantage?
Does the home team have the home field advantage in football? Class members look at a graph that displays wins at home and wins on the road for each NFL team from 2002–2012. Then they answer eight word problems that look at the...
Bowland
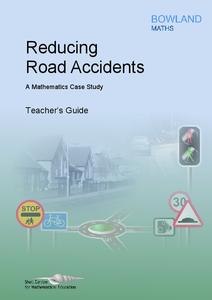
Reducing Road Accidents
By making the following changes to the roads, we can prevent several accidents. A multiple-day lesson prompts pupils to investigate accidents in a small town. Pairs develop a proposal on what to do to help reduce the number of accidents....


