Howard County Schools
Setting the Table
How many people can fit around a table? Depends on the size of the table, right? Explore patterns to generate an equation for the number of people that can fit around a table given its size.
101 Questions
Angry Bird Quadratics
Launch your classes into a modeling lesson. Young scholars watch angry bird trajectories and make predictions based on their knowledge of quadratic functions. The lesson includes a series of questioning strategies to lead learners to the...
101 Questions
Styrofoam Cups
How many cups does it take to reach the top? Learners attempt to answer this through a series of questions. They collect dimension information and apply it to creating a function. The lesson encourages various solution methods and...
101 Questions
The Biggest Loser
Sometimes losing is actually winning! Learners use a proportional analysis to compare percent weight loss of contestants on The Biggest Loser. The resource provides data and clips from the show to facilitate the lesson.
101 Questions
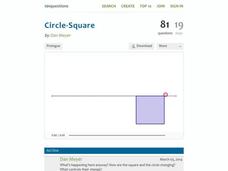
Circle-Square
How do the area and perimeters of circles and squares compare? A clever video illustrates the change in the area of a circle and square while their total perimeter stays the same. The task is for learners to predict the point where the...
Howard Hughes Medical Institute
Understanding Variation
Does where we live influence how our bodies express genetic traits? Explore variation in human skin color with an activity that incorporate video and hands-on learning. Individuals model the relationship between phenotypes and genotypes,...
Yummy Math
Raspberry Chocolate Heart Cake
Have you ever finished a piece of cake and wished you had more? Solve this common dilemma with math! A straightforward worksheet prompts middle schoolers to use the given dimensions of a heart-shaped cake when planning to bake two larger...
Shodor Education Foundation
Caesar Cipher
Caesar ciphers hide secret missives. A simple interactive lets users encode and decode hidden messages. The cipher method here is the Caesar shift.
Shodor Education Foundation
Multi-Function Data Flyer
Explore different types of functions using an interactive lesson. Learners enter functions and view the accompanying graphs. They can choose to show key features or adjust the scale of the graph.
Shodor Education Foundation
Incline
Study velocity while examining graphical representations. As scholars work with the animation, they discover the effect the height of an incline has on the velocity of the biker. They make conclusions about the slope of the line in terms...
Mathematics Assessment Project
Representing Trigonometric Functions
Discover the classic example of periodicity: Ferris wheels. Young mathematicians learn about trigonometric functions through Ferris wheels. They match functions to their graphs and relate the functions to the context.
Beyond Benign
The Big Melt: Arctic Ice Caps
Are the Arctic ice caps really melting out of existence? Junior climatologists examine the statistics of ice decline through four math-based lessons. Each activity incorporates data, climate information, and environmental impact into an...
CK-12 Foundation
Problem-Solving Models: Subway vs. Taxi
Ride to success in understanding systems of equations. Scholars graph a system of equations on the cost of a subway and a taxi using an interactive. Using this graph allows users to answer some questions about the situation.
Education Development Center
Distance, Rate, and Time—Walking Home
Dig into a classic math problem with your classes. Through an engaging task, learners work with rate and distance information to make conclusions. In the task, two people walk at different rates; one leaves first, and scholars calculate...
NASA
Understanding the Effects of Differences in Speed—Problem Set D
Fall back and slow down. The fourth lesson in a six-part series on air traffic control leads the class to find the difference in distance traveled based upon the difference in speed. Pupils work through a problem related to walking...
CK-12 Foundation
Inverse Variation Models: Speedometer for Inverse Variation Models
Model inverse variation while solving a real-world problem. Young scholars use the interactive lesson to discover the pattern of inverse variation data. They then use that discovery to write and analyze an equation.
Noyce Foundation
Once Upon a Time
Examine the relationship between time and geometry. A series of five lessons provides a grade-appropriate problem from elementary through high school. Each problem asks learners to compare the movement of the hands on a clock to an angle...
Noyce Foundation
Tri-Triangles
Develop an understanding of algebraic sequences through an exploration of patterns. Five leveled problems target grade levels from elementary through high school. Each problem asks young mathematicians to recognize a geometric pattern....
Noyce Foundation
Surrounded and Covered
What effect does changing the perimeter have on the area of a figure? The five problems in the resource explore this question at various grade levels. Elementary problems focus on the perimeter of rectangles and irregular figures with...
Teach Engineering
Amusement Park Ride: The Ups and Downs in Design
Groups design the ultimate roller coaster by considering potential and kinetic energy. They test their designs using marbles and then go on to rate each group's design based on aesthetics, loop diameter, and cost.
Virginia Department of Education
Greetings
Welcome learners to the world of algebra. Use a lesson that poses a situation involving the profit from creating greeting cards to teach about algebra. It requires scholars to use linear functions and inequalities to solve problems.
Virginia Department of Education
Inequalities
Compare graphing an inequality in one variable on a number line to graphing an inequality in two variables on a coordinate plane. Young mathematicians work on a puzzle matching inequalities and their solutions. They then complete a...
Yummy Math
Deflate-gate
Does temperature affect the air pressure of a football? Young mathematicians look at the readings from a pressure gauge and determine if the balls are within regulation or are under inflated.
Balanced Assessment
Number Game
It's all in the numbers! Create a mathematical model to analyze a number game and develop a winning strategy. Using a given numerical pattern, scholars write an expression to model the scenario. They then interpret the pattern of the...


