National Research Center for Career and Technical Education
Architecture and Construction: Stair Construction
Within the context of the construction industry, algebra pros begin to calculate slope from the sizes of stair steps. This is a terrific instructional activity, especially for aspiring engineers. Just be aware that it might be a stretch...
National Research Center for Career and Technical Education
Hospitality and Tourism 1: Safety and Sanitation
Math and science come alive in this career-related lesson on sanitation. Along the way, learners explore bacterial growth rates using exponential notation and graphs. A link to a very brief, but vivid video shows just how quickly these...
Curated OER
Interpreting Statistics: A Case of Muddying the Waters
Is river pollution affecting the number of visitors to Riverside Center, and is the factory built upstream the cause of the pollution? Let your class be the judge, literally, as they weigh the statistical evidence offered by the factory...
Curated OER
Representing Data 2: Using Box Plots
What information can be gleaned from a box and whiskers plot? Discuss the five summary values - minimum, maximum, upper and lower quartiles, and median - and what conclusions can be made from these values? Included here is a matching...
Curated OER
Representing Data 1: Using Frequency Graphs
Here is a lesson that focuses on the use of frequency graphs to identify a range of measures and makes sense of data in a real-world context as well as constructing frequency graphs given information about the mean, median, and range of...
Mathed Up!
Histograms
Class members explore how to read and use histograms by watching a video on creating and analyzing histograms. To finish, the class works on a set of questions that tests these skills.
Teach Engineering
Complex Networks and Graphs
Show your class how engineers use graphs to understand large and complex systems. The resource provides the beginnings of graph theory by introducing the class to set theory, graphs, and degree distributions of a graph.
Georgia Department of Education
The Basketball Star
Have learners use math to prove they are sports stars! Assess a pupil's ability to create and analyze data using a variety of graphs. The class will be motivated by the association of math and basketball data.
National Research Center for Career and Technical Education
Health Science: Back to Basics
This lesson plan focuses on unit conversion, proportions, ratios, exponents, and the metric system. Discuss measurement with your math class and demonstrate how to solve several health-science word problems. Give learners a chance to...
Illustrative Mathematics
Accuracy of Carbon 14 Dating I
Here is an activity that is intended to highlight a very important issue about precision in reporting and understanding statements in a realistic scientific context. Discuss different ways of reporting the half life of Carbon 14...
Curated OER
Application and Modeling of Standard Deviation
The first activity in this resource has learners computing the mean and standard deviation of two different data sets and drawing conclusions based on their results. The second activity has them using a dice-rolling simulation to...
Illustrative Mathematics
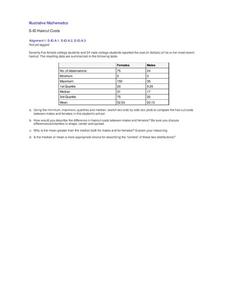
Haircut Costs
Who pays more for haircuts, men or women? Given quartile values, learners construct box and whiskers plots and interpret the results. They compare the mean and median, and discuss which is more appropriate under particular conditions....
Illustrative Mathematics
Speed Trap
In which direction is traffic moving faster, north or south? Use box and whisker plots to organize data and interpret the results. Detailed solutions are included. This activity would be good as a warm up or quick assessment at the...
Alabama Learning Exchange
I Know What You Did Last Summer: A Data Graphing Project
Young scholars participate in graphing data. In this graphing data lesson, students make a stem and leaf plot of their summer activities. Young scholars create numerous graphs on poster boards. Students discuss the...
Curated OER
Transforming Univariate Data
Learners analyze plotted data in this statistics lesson. They differentiate between skewed and normal data. They also explore and interconnect exponential growth and decay as it relates to the data.
Texas Instruments
Data Collection for Bar Graphs
Learners study the concept of central tendency in this data collection for bar graph lesson plan. They collect data outside as instructed and organize it into a bar graphs, then they list in specific groups the labels that appear on the...
Alabama Learning Exchange
The State Capital of Stem and Leaf
Students explore the concept of stem and leaf plots. In this stem and leaf plots lesson, students plot the 50 US states' capitals on a stem and leaf plot according to the first letter of each state. Students compare...
University of South Florida
Fcat: Drops on a Penny: Teacher Notes
Young scholars learn how to create stem-and-leaf diagrams and boxplots by collecting data on the surface tension of water molecules. This hands-on activity using pennies is a great way to learn how to organize data.
Shodor Education Foundation
Shodor Interactivate: Lesson: Algorithm Discovery With Venn Diagrams
The lesson plan, with objectives, lesson outline, and interactive resources, helps learners learn about algorithms using box plots and Venn diagrams.
Math Is Fun
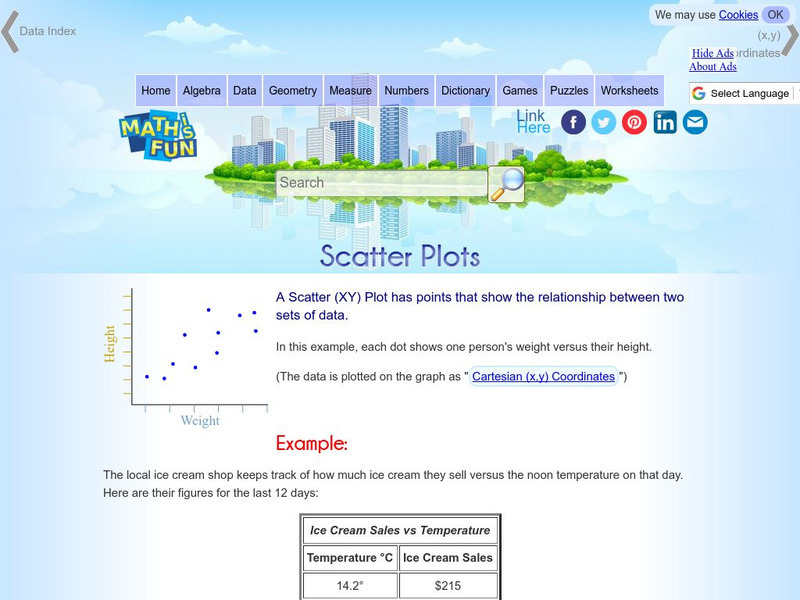
Math Is Fun: Scatter Plots
Explains, with examples, what scatter plots are and how to interpret the data. Discusses trends, interpolation and extrapolation, and correlation. Includes a set of practice questions.
Other
Online Statistics Education: Graphing Distributions [Pdf]
This is the second chapter of a statistics e-text developed collaboratively by Rice University, University of Houston Clear Lake, and Tufts University. It looks at many different types of data displays and the advantages and...
CK-12 Foundation
Ck 12: Interactive Algebra 1 for Ccss
This is a complete, full-year Algebra 1 course with interactivity included in every lesson. Some lessons include videos, and all include interactives and inline questions that offer instant, per-answer feedback. Every lesson also has...
Cuemath
Cuemath: Dot Plot
A comprehensive guide for learning all about dot plots with definitions, how to construct them, solved examples, and practice questions.
Cuemath
Cuemath: Scatter Plot
A comprehensive guide for learning all about scatter plots with definitions, how to construct and solve them, types of scatter plots, solved examples, and practice questions.










![Online Statistics Education: Graphing Distributions [Pdf] eBook Online Statistics Education: Graphing Distributions [Pdf] eBook](https://d15y2dacu3jp90.cloudfront.net/images/attachment_defaults/resource/large/FPO-knovation.png)