College Board
1998 AP® Calculus AB Free-Response Questions
Take a peek into the exam. Released items from the Calculus AB exam provide pupils insight into how questions appear on the exam. The six questions range from finding the area under a curve and the volume of the revolution to working...
CCSS Math Activities
Smarter Balanced Sample Items: High School Math – Target E
Pupils rewrite expressions in equivalent forms to identify key features. They use the vertex and factored forms of quadratic expressions to identify the extrema and intercepts. To finish the installment of the Claim 1 Item Slide Show...
Mathematics Vision Project
Module 6: Quadratic Functions
Linear, exponential, now it's time for quadratic patterns! Learners build on their skills of modeling patterns by analyzing situations with quadratic functions. The sixth module in the Algebra I series has pupils analyze multiple...
Shodor Education Foundation
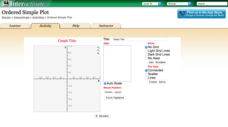
Ordered Simple Plot
Open your imagination to make algebra-inspired creations. An interactive lesson has scholars graph images from a set of parameters. Users can practice minimum values, maximum values, and scale as well as key features.
Mathematics Assessment Project
Representing Quadratic Functions Graphically
Sometimes being different is an advantage. An engaging activity has scholars match cards with quadratic functions in various forms. Along the way, they learn about how each form highlights key features of quadratic functions.
CK-12 Foundation
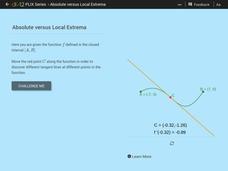
Absolute Versus Local Extrema
Get the class to take an extreme look at functions. The interactive presents a function on a closed interval with a movable tangent line. Using the given function, pupils determine the extrema, critical points, and points of inflection.
West Contra Costa Unified School District
Quadratic Equations — What We Know
Everything you could possibly want to know about quadratic equations, all in one resource. Instructors demonstrate how to translate between different forms of quadratics (equation, table of values, graph, verbal description) and finding...
Mathematics Assessment Project
Temperatures
As a middle school assessment task, learners first examine line graphs of monthly temperatures for two locations, and then match box plots to each line plot.
EngageNY
Graphing the Sine and Cosine Functions
Doing is more effective than watching. Learners use spaghetti to discover the relationship between the unit circle and the graph of the sine and cosine functions. As they measure lengths on the unit circle and transfer them to a...
West Contra Costa Unified School District
Using Derivatives to Graph Polynomials
You can learn to graph as well as a calculator using calculus. The lesson introduces using derivatives to find critical points needed to graph polynomials. Pupils learn to find local maximums and minimums and intervals of increase and...
West Contra Costa Unified School District
The Extreme Value Theorem
Finding the critical numbers of a function can be extreme. The instructional activity introduces the Extreme Value Theorem to the class with a graph. Pupils then have an opportunity to practice determining the values using an algebraic...
West Contra Costa Unified School District
Comparing Linear and Quadratic Functions
If a linear function and a quadratic function enter a boxing match, which one would win? Learners first review how to find key features of linear and quadratic functions. Next, they compare key features of pairs of functions.
Mathematics Assessment Project
Bestsize Cans
Traditional calculus problem made simple. In the high school assessment task, learners determine the minimum surface area for a can of a given volume using algebraic and numerical methods to solve the problem. No calculus required.
Willow Tree
Box-and-Whisker Plots
Whiskers are not just for cats! Pupils create box-and-whisker plots from given data sets. They analyze the data using the graphs as their guide.
Willow Tree
Extremes, Range, and Quartiles
The middle of the data is important, but what about the rest of it? The lesson shows learners the importance of the range, quartiles, and extreme values. Pupils practice finding each of these values from given data sets.
Mathematics Assessment Project
Seeing Structure in Expressions
Structure makes everything easier — even math. A helpful resource contains five short problems that require pupils to use the structure of the expressions in order to answer the questions.
Charleston School District
Increasing, Decreasing, Max, and Min
Roller coaster cars traveling along a graph create quite a story! The lesson analyzes both linear and non-linear graphs. Learners determine the intervals that a graph is increasing and/or decreasing and to locate maximum and/or minimum...
Charleston School District
Review Unit 3: Functions
Time to show what you know about functions! The review concludes a series of nine lessons on the basics of functions. The problems included are modeled from the previous lessons. Pupils determine if a table represents a function,...
Charleston School District
Contextualizing Function Qualities
Let the graph tell the story! Adding context to graphs allows learners to analyze the key features of the function. They make conclusions about the situation based on the areas the graph is increasing, decreasing, or has a maximum or...
West Contra Costa Unified School District
Key Features of Graphs
The key is ... After a day of instruction on key features of graphs, groups create a poster and presentation on the key features of their given function graph. The resource provides an extension activity of "telephone" using graphs.
Curated OER
Lesson 2-5: Absolute Value Functions and Graphs
What is absolute value? What is an absolute value function? Emerging mathematicians solve equations containing variables inside an absolute value sign. They graph each function on a coordinate plane and identify the maximum and minimum...
Curated OER
Maximum/ Minimum Problems
In this optimization worksheet, students solve 20 short answer word problems. Students read, sketch, define variables, write equations, differentiate their equations, and find the maximum or minimum of each word problem.
Radford University
“FUN-ctions” Find the Equation of a Scream
Take a function along for a ride. Given the graph of a roller coaster track, pupils determine key features of the graph such as the maximum, minimum, intervals of increase and decrease, and roots. They figure out the equation of the...
Mathed Up!
Cumulative Frequency and Box Plots
Learn how to display data. Young data analysts watch a video to review how to create cumulative frequency histograms and box plots. They work on a set of questions to practice producing these data displays.


