Other
Bucks County Community College: Visual Organizers
This site walks you through the benefits of visual organizers, and focuses on a variety of types: tables, charts, graphs, timelines, flowcharts, diagrams, and webs.
Texas Education Agency
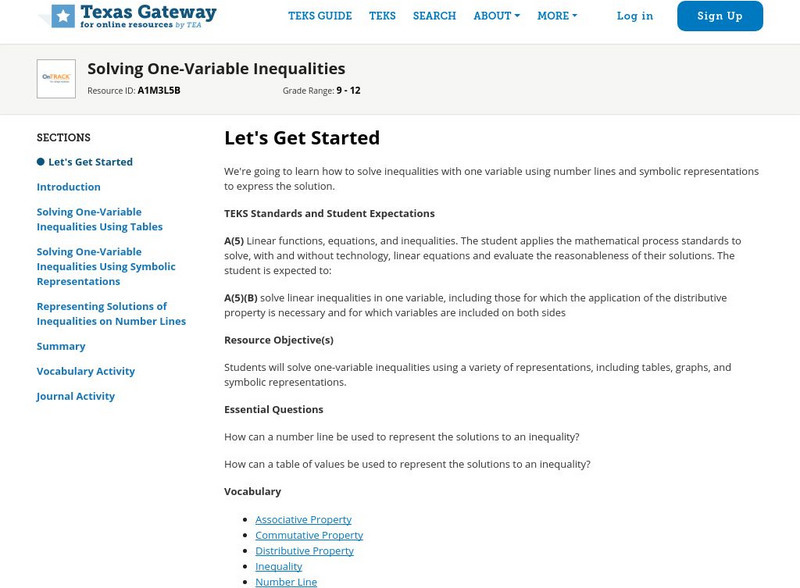
Texas Gateway: Solving One Variable Inequalities
Students will solve one-variable inequalities using a variety of representations, including tables, graphs, and symbolic representations.
PBS
Pbs Learning Media: Garden Spiders
In this video segment from Garden Insects, learn about six varieties of spiders that live in one garden. [2:40]
PBS
Pbs Learning Media: Molly of Denali: Sled Dog Dash Game
Use this Molly of Denali digital game to extend and expand children's use of informational text, as well as their knowledge of Alaska Native culture. Molly and her friend Tooey use a fictional app to access information that will help...
Texas Instruments
Texas Instruments: Tables
In this activity, students make use of the Derive software and explore expansions of binomial expressions.
Other
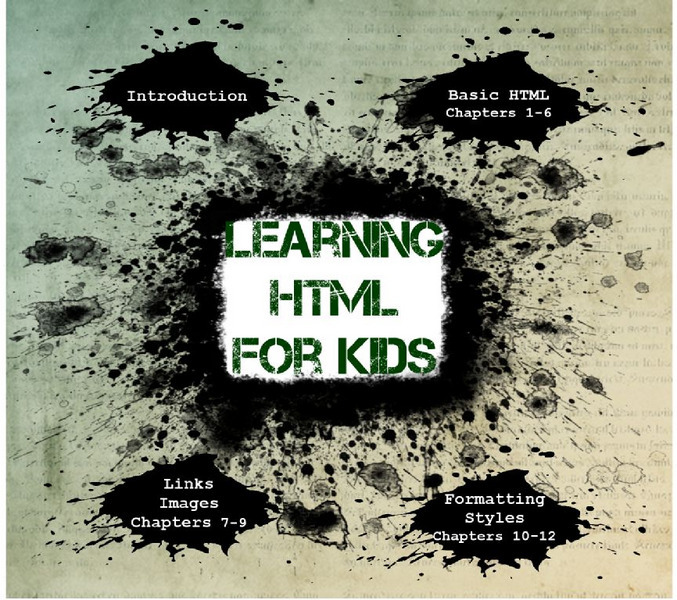
Goodell Group: Learning Html for Kids
This tutorial provides 12 step-by-step lessons for young children to learn HTML.
Other
Stat Soft: Statistics Glossary
Dozens of statistical terms are defined and illustrated in this glossary.
Other
Elated Communications: Html Tutorial
This site is on how to write web pages using HyperText Markup Language, from beginner's lessons to more advanced tutorials. Whether you're just starting out with your first website, or a seasoned HTML expert, these great HTML tips aim to...
Texas Instruments
Texas Instruments: Understanding Limits
This activity is designed to show students how to use a graphing calculator to find a limit by graphing, investigating a table, and by using the calc menu. (Continued. See "before the activity.")
Illustrative Mathematics
Illustrative Mathematics: 6.ee Chocolate Bar Sales
n this task learners use different representations to analyze the relationship between two quantities and to solve a real world problem. The situation presented provides a good opportunity to make connections between the information...
Mangahigh
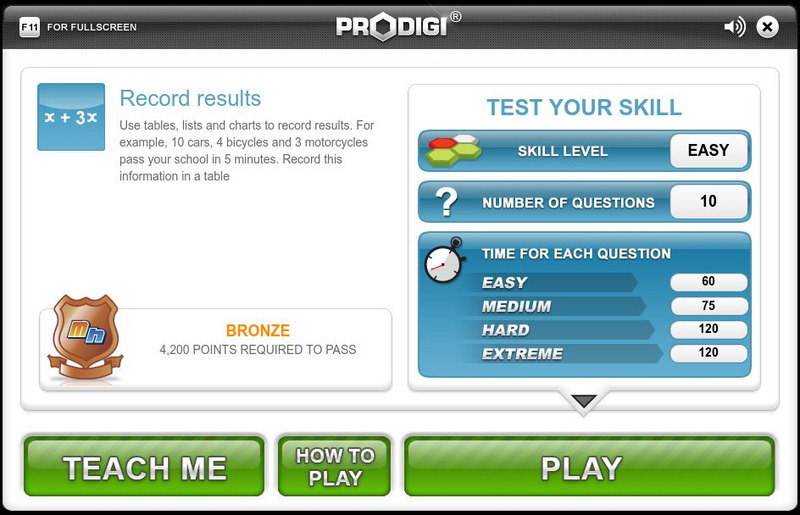
Mangahigh: Data: Record Results
Students explore the concept of recording data by working through an online tutorial and then attempting a ten question quiz that increases in difficulty as questions are answered correctly.
Other
School House Technologies: Free Math Worksheets for Teachers
A collection of math worksheets covering a multitude of math topics.
National Council of Teachers of Mathematics
Nctm: Figure This: Does Drinking Soda Affect Your Health?
Try this "Real world," challenge taken directly from the today's health journals. Use your problem solving, data analysis, and number sense skills to figure out if soda intake among teenage girls is related to incidences of broken bones....
Texas Instruments
Texas Instruments: Using a Table to Make Conjectures
This activity is used to practice making tables for investigating a geometrical problem and to develop techniques for trying different constructions to prove a theorem.
Texas Education Agency
Texas Gateway: Predicting, Finding, and Justifying Solutions to Problems
Given application problems, the student will use appropriate tables, graphs, and algebraic equations to find and justify solutions to problems.
University of North Carolina
University of North Carolina Writing Center Handouts: Statistics
When presenting an argument, the use of statistics to support a point can be very effective. This handout offers advice on both how to read statistics so that you understand exactly what they mean, and how to use them in your argument so...
University of Texas at Austin
Mathematics Teks Toolkit: Making Connections
In this lesson, students will use input/output tables to explore functions, equations, and graphs.
Goodwill
Gcf Global: Access 2016
In this tutorial, learn how to enter, manage, and search through large amounts of data in an Access database.
University of North Carolina
University of North Carolina: The Writing Center: Scientific Reports
A handout exploring how to complete a scientific report based on scientific research. The site describes the sections needed as well as how to insert graphs and tables.
BBC
Bbc Skillswise: Graphs: Lists and Tables
Resource shows how to use lists and tables to organize information.
Common Core Sheets
Common Core Sheets: Functions 8.f.1 Worksheets
Print or create worksheets to assess students' understanding of identifying functions.
Common Core Sheets
Common Core Sheets: Functions 8.f.3 Worksheets
Print or create worksheets to assess students' understanding of linear functions.
Common Core Sheets
Common Core Sheets: Ratios and Proportional Relationships 6.rp.3a Worksheets
Print or create worksheets or flashcards to assess students' understanding of ratio concepts and creating tables and graphs.


