Curated OER
Agriculture and the Government
Students study the government's involvement in the U.S. A's food production and make connections relating to farm programs. In this historical agriculture lesson, students read content and research significant information. Students then...
Curated OER
Assessing and Investigating Population Data
Students examine population projections. In this population data lesson, students research and collect data on the population of the United States. They explore and conclude future population growth patterns. Students construct tables...
Curated OER
When Ants Fly
Here is a great lesson on constructing line graphs. Learners identify common characteristics of birds, ants common needs of all living things. They also write a story from the perspective of an ant or a bird that has lost its home and...
Curated OER
Fractions in Action
Investigate equivalent fractions with your class. They compare and order fractions. Then they work cooperatively in groups to experiment and problem solve with fractions using a game format. Multiple resources are provided.
Techbridge Curriculum
Calculating Rainwater Runoff
Thirsty plants soak up every bit of a rainfall, but what happens to the rain that hits the roof? Calculate the amount of rainwater from your school's roof with an Earth science activity, which brings measurement skills, observation...
Curated OER
Olympic Decimals
Add competitive event times, expressed in decimals, to determine the winners! Individuals use a chart showing competitors' times in four events to figure each team's total time and individual standing.
Curated OER
Giant Mystery
Third graders determine the relationship between hand size and body size using centimeters as the unit of measure, They use the relationship to find the size of a hypothetical giant. They graph the measurements using a spreadsheet program.
Curated OER
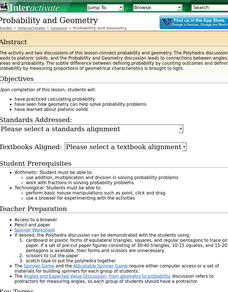
Probability and Geometry
Students practice calculating probability, see how geometry can help solve probability problems and explore platonic solids.
Curated OER
Create Your Own Form
Students gather and organize data using a mock census form, and determine mean, mode, range, and median for sets of data.
Curated OER
Parachute Drop
Students explore the effects of gravity. They create a parachute and make predictions about the effect of adding weight to the bottom of the parachute. Students record and interpret results of parachute experiments.
Curated OER
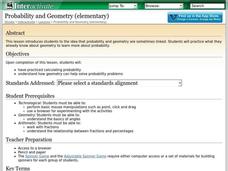
Probability and Geometry
Students examine the relationship between probability and geometry to solve problems. In this geometry and probability lesson, students investigate the effect of changing percentages on a spinner to the probability of landing on a...
Curated OER
Dealing with Data in Elementary School
Students follow the scientific method in collecting data. In this following the scientific method in collecting data instructional activity, students develop a question they would like answered such as how many aluminum cans are...
Texas Commission on the Arts
The Quarter Fold
Little ones identify the US quarter and explore the concept of one-fourth or one-quarter. Using real coins or coin manipulatives, they divide a square piece of paper into quarters, discuss halves and quarters, and create a design that...
Curated OER
What Does Average Look Like?
Fifth graders explore the concepts of range, median, mode, and mean through the use of graphs drawn from models. They use manipulatives to represent data they have collected within their groups, and compare the differences between mode,...
Curated OER
Figure This Out
Students measure different parts of the human body. In this measurement activity, students work in pairs to take measurements of human measurements which include: arm span, height, foot length, and wrist to longest finger. They also...
Curated OER
Line 'Em Up!
Students find coordinate points on a grid and create a line graph with those points. This lesson should ideally be used during a unit on various types of graphs. They make and use coordinate systems to specify locations and to describe...
Curated OER
Combination Factory
Fourth graders use cut-outs of clothing to illustrate the numbers of combinations of articles of clothing they can create. Students create a tree-diagram and count the number of possibilities. They practice showing the information in...
Curated OER
Michigan Virtual Field Trip
Learners analyze data from a virtual field trip to Michigan. They conduct Internet research on mileage and travel time between cities, calculate and compare fuel costs, and research and calculate lodging, activities, and meal costs.
Curated OER
Lego Robotics: Measuring Speed
Students build and program a LEGO robotic car as well as measure and graph its speed. They acquire familiarity with principles of construction, motion, design and problem solving. They compare a robot's speed over two different surfaces...
Curated OER
Graph the Presidents At Inauguration- How Old Were They?
Students construct a graph of the presidents' ages at inauguration. In this U.S. history instructional activity, students use online resources to gather data about the presidents and accurately present their results on a graph.
Curated OER
Tall Tale Rollers
Students explore American tall tales. In this tall tale lesson, students discover the six characteristics that are included in tall tales. Students survey their class to find each student's favorite tall tale character and organize the...
Curated OER
How Probable is It?
Students explore probability. In this probability lesson, students look at videos and websites where they discover probability facts that can be used in situations. They determine the probability of different events.
Curated OER
Jabberwocky: A Lake and Island Board Project
A mathematical role play using Lake and Island Boards where students plan to move from Jabberwocky to their new planet
Curated OER
Looking for More Clues
Fifth graders explore how to collect data and display it on a bar and circle graph.
Other popular searches
- Football Math Statistics
- Baseball Math Statistics
- Math Statistics Simulation
- Math Statistics Survey
- Math Statistics Lesson
- Games Math Statistics
- Math Statistics Histograms
- Sneeze Math Statistics
- Saxon Math Statistics
- Statistics Math Project
- Jeopardy Math Statistics
- Math Statistics Correlation


