Curated OER
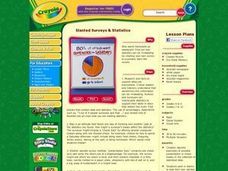
Slanted Surveys And Statistics
Students engage in a lesson that is concerned with the use of statistics and surveys and how they should be read. They create a survey and take it home to collect data. Then students display the data on a graph that is displayed in class.
Illustrative Mathematics
Buttons: Statistical Questions
Here is a nice activity about recognizing the difference between a statistical question and answer and one that anticipates a fixed answer. From this, your future statisticians will develop an understanding of variability and be able to...
Curated OER
Adventures in Statistics
Here is a fantastic lesson for your fifth grade math scholars. In it, learners must determine if the classrooms of upper graders are bigger, or smaller, than the classrooms of the lower grades. Some excellent worksheets are embedded in...
Curated OER
Yummy Math
Young mathematicians use bags of Skittles to help them gain practice in graphing and organizing data. They work in pairs, and after they have counted and organized their Skittles, they access a computer program which allows them to print...
Curated OER
Penny Basketball: Making Sense of Data
Explore four web-based interactive sites to develop a baseline understanding of statistics. Learners play a series of penny basketball games and collect data regarding their shooting statistics. Groups decide who is the "top" penny...
Curated OER
Drive the Data Derby
Three days of race car design and driving through the classroom while guessing probability could be a third graders dream. Learn to record car speed, distances traveled, and statistics by using calculation ranges using the mean, median,...
Curated OER
Probability and Statistics
Elementary schoolers choose from a host of activities to investigate probability and statistics. They complete worksheets, create 3-D graphs, and play graph bingo. They make weather predictions and list all the possibilities before going...
Curated OER
Aboriginal Statistics
Fourth graders analyze statistics of Native Americans by creating graphs. In this data analysis lesson, 4th graders define different statistical terms and practice finding those statistics from groups of numerical information about...
Curated OER
The Three M's of Statistics: Mode, Median, Mean
Young mathematicians use the Visual Thesaurus to define mean, median, and mode. In this mean, median and mode lesson, learners use online sources to find the definitions of mean, median, and mode before applying the concepts to a class...
Curated OER
Did Voters Turn Out -- or Are They Turned Off?
What was the voter turnout at your last state election? Examine voter turnout statistics from the most recent election to learn which ten states have the best turnout record. This lesson offers election data, handouts, and worksheets.
Curated OER
Chances Are......You're Right
Young mathematicians study probability. In this math lesson, learners calculate odds, and convert those into percentages of probability. Fractions are also used, making this lesson quite rich in some of the more difficult conversions...
Curated OER
Operation Spaghetti
Find the math in recipes. Young chefs will follow a recipe and investigate the total cost for materials. They measure amounts of food necessary for the recipe and compute the per person cost.
American Statistical Association
Candy Judging
Determine the class favorite. The statistics lesson plan has pupils collect, display, and analyze data. Pairs rank four kinds of candy based on their individual preferences. Working as an entire class, learners determine a way to display...
Curated OER
Button Bonanza
Collections of data represented in stem and leaf plots are organized by young statisticians as they embark some math engaging activities.
Curated OER
Penny's Pizza
Students develop a list of possible outcomes as a method of finding probability related to a pizza statistics problems. They read the problems together as a class, brainstorm ways to solve the problem, and in partners solve the pizza...
Curated OER
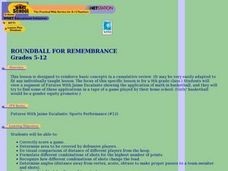
Roundball for Remembrance
Students view a segment of Futures With Jaime Escalante showing the application of math in basketball, and they try to find some of these applications in a tape of a game played by their home school. This fun lesson should be very...
Curated OER
Calculating Baseball Statistics
Students calculate baseball statistics. In this data analysis lesson plan, students use baseball statistics to calculate the batting average and slugging percentage. Students visit www.funbrain.com to play a math baseball game.
Curated OER
Data Display
Students explore different ways to display data. In this statistics instructional activity, students create pie charts, bar graphs and line graphs to show data. Students then write a paragraph discussing which types of graphs are helpful...
Curated OER
Wave Math
Students identify the different factors affecting the size and shape of ocean waves. In this math instructional activity, students calculate wave speed and wavelength given a mathematical formula.
Curated OER
Lady Liberty
If you're looking for a fantastic cross-curricular lesson on the Statue of Liberty, then this lesson is for you! Learners watch a Reading Rainbow episode which focuses on the Statue, then gather facts about the creation, construction,...
Curated OER
Gold Rush California and its Diverse Population
Young scholars compare contemporary cultural differences with historical differences based on population percentage. In this cross-curriculum Gold Rush/math lesson, students analyze aspects of California's Gold Rush population and...
Curated OER
Energy Audit
Students collect data about energy usage and use mathematical calculations to analyze their data. In this energy conservation and statistics math activity, students survey their homes to complete an energy usage worksheet. Students...
Mathematics Assessment Project
Mean, Median, Mode, and Range
What a find! Here is a lesson plan, designed to meet sixth grade math Common Core standards, that focuses on the calculation of different measures of center for the scores from a penalty shoot-out competition. An independent...
NTTI
Line 'Em Up!
Coordinate planes and Cartesian graphing systems are the focus of this math lesson. Learners use video, internet activities, and engage in hands-on activities in order to explore coordinate planes. The materials needed for this lesson...
Other popular searches
- Football Math Statistics
- Baseball Math Statistics
- Math Statistics Simulation
- Math Statistics Survey
- Math Statistics Lesson
- Games Math Statistics
- Math Statistics Histograms
- Sneeze Math Statistics
- Saxon Math Statistics
- Statistics Math Project
- Jeopardy Math Statistics
- Math Statistics Correlation


