Curated OER
Data and Probability: What is the Best Snack?
In this math/nutrition lesson, the nutritional value of 3 snack foods is recorded on a data chart and represented on a bar graph. Students analyze and compare information, construct data charts and related bar graphs, and draw...
Curated OER
Sweet Data
Students input data about the colors of their serving of M&M candies onto a spreadsheet. They create charts and graphs based on this information.
Curated OER
Deep Convective Clouds
Young scholars observe clouds. In this deep convective clouds lesson, students analyze cloud data recorded over one month and draw conclusions based on results. Young scholars predict "Thunderstorm Season" and prepare to defend their...
Curated OER
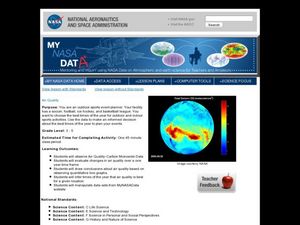
Air Quality
Students observe air quality and monoxide data. For this air quality lesson, students draw conclusions and manipulate data from a one year period on changes in air quality.
Curated OER
Cold, Clouds, and Snowflakes
Students explore satellite data and graphing. In this weather data analysis math and science lesson, students analyze NASA satellite data to draw conclusions about geographical areas where precipitation might have happened. Students...
Curated OER
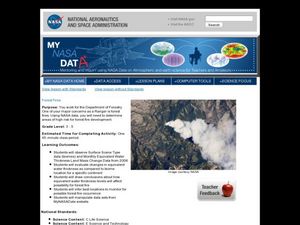
Forest Fires
Students play the role of a Ranger with the Department of Forestry. In this forest fires instructional activity, students examine data on biomes and images to determine high risk areas for forest fires to develop.
Curated OER
Assessing and Investigating Population Data
Students examine population projections. In this population data lesson, students research and collect data on the population of the United States. They explore and conclude future population growth patterns. Students construct tables...
Curated OER
Data Analysis, Probability, and Discrete Mathematics
Fourth graders analyze the data in a bar graph, pictograph, line graph, and a chart/table and draw conclusions based on the data. They discuss each type of graph, write questions for each graph, and analyze the data as a class.
Curated OER
Handling Data: Representing Date - Online Version
Here is an online lesson plan on data representation. In it, learners access websites embedded in the plan which lead them through a variety of activities around data representation and statistics. The activities are quite good, and...
PBS
Investigating Daily and Seasonal Weather
Talking about weather isn't just for making conversation. Young scientists gather evidence from an interactive activity to make connections between daily and seasonal weather. They analyze data from different areas and compare the...
Curated OER
Did Voters Turn Out -- or Are They Turned Off?
What was the voter turnout at your last state election? Examine voter turnout statistics from the most recent election to learn which ten states have the best turnout record. This lesson offers election data, handouts, and worksheets.
Curated OER
Gee, It's Crowded in Here
Learners interpret raw data about population statistics. In this raw data lesson plan, students plug the data into graphic organizers and draw conclusions based on their findings.
Curated OER
Collecting Data and Graphing
Young mathematicians collect data and graph it. They work collaboratively to collect data regarding the span of arm length versus height and graph the data they collect.
Curated OER
Dealing With Data
Learners collect, organize, and display data using a bar graph, line graph, pie graph, or picture graph. They write a summary describing the data represented and compare the graph to another graph in the class.
Curated OER
Survey of Height
For this data collection worksheet, students survey the heights of their fellow classmates, organize their data in a data table, and create a bar graph from their data. Once bar graph is completed, students complete 2 short answer...
Curated OER
Data With Candy
Learners, while utilizing the classroom and the computer lab with a bag of colored candy, gather and interpret data, calculate averages and draw conclusions and draw a bar graph. They estimate how many candies are in the bag, what...
Curated OER
Fish Communities in the Hudson
Learning to read data tables is an important skill. Use this resource for your third, fourth, or fifth graders. Learners will will study tables of fish collection data to draw conclusions. The data is based on fish environments in the...
Curated OER
Favorite Days
Students collect and organize data about themselves. In this data analysis lesson, students discuss their favorite calendar dates and explore ways to display the data.
Curated OER
Tracking Ocean Ecology
Students look at the data maps given to them about how chlorophyll affects the algae blooms and make predictions about the harm they will cause. In this data maps lesson plan, students manipulate data sets from the website.
Curated OER
Populations and Life Cycles
Students explore biology by researching ocean statistics. In this data analysis instructional activity, students conduct a snail examination experiment utilizing live pouch snails. Students collect data about the snails over the course...
Purdue University
The Case of the Pilfered Pin: A Measurement Inquiry Activity
Who pilfered the pin? Scholars practice measurement skills as they solve the mystery of a stolen pin. They measure length, temperature, and mass and determine which of select suspects committed the crime. During the STEM hands-on...
Curated OER
Pizza, Pizza
Students survey community members to determine their favorite pizza toppings and create a bar graph to show their findings. In this probability and statistics lesson, students collect data by conducting a survey. They analyze the data,...
NASA
Cloudy vs. Clear - Graphs
Explore the link between solar energy and cloud cover using real data from NASA from China! Future climatologists analyze and interpret graphs of solar energy on clear and cloudy days using a literacy cube. Investigators draw conclusions...
Purdue University
Animal Diversity and Tracking
What exactly are those glowing eyes in the night? Learners run an experiment to attract local wildlife and then document the number of visitors by identifying their tracks. They then analyze the data to draw conclusions about the types...


