Curated OER
The Stock Market Game
Students explore the stock market. They choose a company and research the company's financial report. Students select 4-10 stocks and become an advocate for one stock. Using spreadsheet software, students compare stocks. They analyze...
Curated OER
Everybody Needs a Rock
Students, after making quantitative and qualitative observations of their rocks, construct a Venn diagram or dichotomous key to classify their rocks.
Curated OER
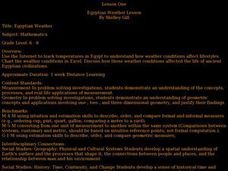
Egyptian Weather Lesson
Young scholars chart temperatures in Egypt on spreadsheet to determine how weather conditions affect lifestyles.
Curated OER
Computer Graphing
Students research the Internet or create surveys to find graphable data. They collect, organize, analyze and interpret the data. Finally, they choose the appropriate type of graph to display the data and find the measures of central...
Curated OER
Those Golden Jeans
Students review the productives resources used to produce goods and services and explore how decisions are made in a market economy through the interactions of both the buyers and the sellers.
Curated OER
Middle School Home Energy Audit
Seventh graders research the origins of local electrical power and compare costs and methods of generation with other areas of the country or world.
Curated OER
Studies of the Eastern Worlds: Population Graphing
Seventh graders participate in several learning/research stations in which they view artwork from various countries of the Eastern world and collect information on the populations of the Eastern countries. They then use this information...
Curated OER
Sweethearts and Data Analysis
Students explore the concept collecting and representing data. In this collecting and representing data lesson, students record the different colors of sweetheart candies in their sweethearts box. Students create a table of the data and...
Curated OER
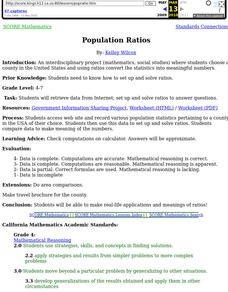
Population Ratios
Students access web site and record various population statistics pertaining to a county in the USA of their choice. They use this data to set up and solve ratios. They compare data to make meaning of the numbers.


