Curated OER
Hunger in the World
Consider various aspects of world hunger in this writing activity. After taking a pre-test, middle and high schoolers play a map game, analyze and discuss world statistics, and write a report on an assigned country. The activity can...
Georgia Department of Education
Math Class
Young analysts use real (provided) data from a class's test scores to practice using statistical tools. Not only do learners calculate measures of center and spread (including mean, median, deviation, and IQ range), but also use this...
EngageNY
Sampling Variability in the Sample Mean (part 2)
Reduce variability for more accurate statistics. Through simulation, learners examine sample data and calculate a sample mean. They understand that increasing the number of samples creates results that are more representative of the...
Curated OER
Hypothesis Testing: Two Sample Tests
High schoolers experiment and compare results of two populations. In this men and women populations lesson, students examine the difference in hand span for men and women. High schoolers calculate a norm based on their results. Students...
Curated OER
The World is a Village
Students observe Americans through the eyes of the world. In this human population lesson plan, students utilize the Internet to view the World Pop Clock and follow the world's population by the minute. Students predict what the...
Statistics Education Web
Did I Trap the Median?
One of the key questions in statistics is whether the results are good enough. Use an activity to help pupils understand the importance of sample size and the effect it has on variability. Groups collect their own sample data and compare...
Curated OER
Will There Be Subsistence Farmers in the 21st Century?: Feeding the World
Students examine the topic of subsistence farming. They research the future of subsistence agriculture, identify the types and locations of subsistence agriculture, and write about subsistence farming in regards to developing nations and...
Deliberating in a Democracy
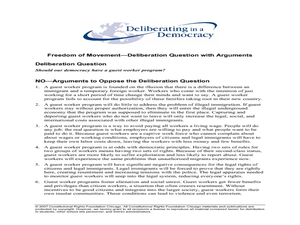
Freedom of Movement
Class members examine human migration. For this population lesson, they read an article entitled, "Freedom of Movement" and respond to discussion questions about the article related to guest worker programs.
Curated OER
Creating a Government
A simulation gives scholars a personal look at what goes into forming a government. Each of them is assigned 1 of 4 tribes which make up Borka, a hypothetical country. The tribe distribution is based on the percentage of people in each....
Curated OER
Fish and Zooplankton Through Remote Sensing
Ecology aces examine sea surface temperature maps and relate temperatures to concentration in fish and zooplankton populations. Take your class to a computer lab and provide experience with actual remote sensing data. Some of the links...
Curated OER
Native Species Restoration and its Impact on Local Populations
Students explore how predators help control the growth of prey species for a more balanced ecosystem.
Curated OER
Whose Water is It Anyway?
Students role play various stakeholders who need water and make a pitch for the water allocation of a pond that is gradually decreasing in depth due to the overuse of water.
Statistics Education Web
Walk the Line
How confident are you? Explore the meaning of a confidence interval using class collected data. Learners analyze data and follow the steps to determine a 95 percent confidence interval. They then interpret the meaning of the confidence...
School Improvement in Maryland
Smart Growth
New roads, new businesses, new developments, new mass transit systems. All growth has both positive and negative effects on communities. Government classes investigate the principles of Maryland's 1997 Smart Growth program and the...
California Academy of Science
Sustainable Food Solutions: Weighing the Pros and Cons
A growing demand for sustainable food systems comes from schools and even some cities. So what are some solutions? Scholars consider four different ways to approach sustainable food solutions and list the pros and cons of each. The fifth...
Curated OER
Hunt for the Serial Arsonist
Students prepare study, and graph fingerprint patterns. They create latent fingerprints and look for common features in their prints for classification.In addition, they create a graph showing the distribution of different patterns...
Curated OER
Peter Rabbit Meets Charles Darwin
Students start to think of evolution in terms of populations. The class follows a cartoon scenario of a rabbit population in which there is selection and change of gene frequency. They receive copies of the scenario or the whole thing...
Curated OER
How Much Water?
Students investigate amount of water available in different countries around the world, compare it to their daily water use, and explore how unequal distribution of water can cause challenges to survival. Students then discuss need to...
Curated OER
Projections and the Census
Students learn why the census makes a difference. In this U.S. Census lesson plan, students connect data and history in their study of previous population booms and analyze census data in order to make predictions about the future.
Curated OER
From Data to Drinks - My Marketing Plan
Learners research and discuss how Canada's aging population affects advertising. They record information from the 2001 census and create a marketing plan to sell a soft drink.
Curated OER
Activity 3: Using Photo Images to Explore Life on the Ocean Floor
Students work in groups with copies of the three photo images provided with the lesson. They make observations about mussels and clams. Students discuss reasons scientists use a representative sample of a population rather than the...
Curated OER
Catch, Tag, and Release
Learners discover how fish tagging is used by marine biologists and fisheries to estimate fish populations. Participating in a simulation, students use estimation to determine the whole population from a small number of items.
Curated OER
Rhinos and M&M's
Students analyze patterns of exponential models by collecting data in paper folding and M&M investigations. They use graphing calculators to create scatter plots that lead to equations for the exponential models. They then apply this...
Curated OER
Time Changes Everything
Students analyze census data from 1915, 1967 and 2006. They read an article about how the world's population is growing at an alarming rate. They use primary source documents to create a timeline on the information they gathered. They...


