EngageNY
Events and Venn Diagrams
Time for statistics and learning to overlap! Learners examine Venn Diagrams as a means to organize data. They then use the diagrams to calculate simple and compound probabilities.
Willow Tree
Histograms and Venn Diagrams
There are many different options for graphing data, which can be overwhelming even for experienced mathematcians. This time, the focus is on histograms and Venn diagrams that highlight the frequency of a range of data and overlap of...
Curated OER
Venn Diagram and UK Basketball
Students analyze data and make inferences. In this algebra activity, students collect and analyze data as they apply it to the real world.
Curated OER
Venn Diagram- Two Circles
In this algebra learning exercise, students use Venn Diagrams to compare and contrast their data given special equations. There are 4 questions with an answer key.
Curated OER
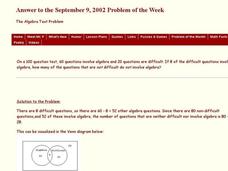
The Algebra Test Problem
In this algebra test worksheet, students construct and interpret a Venn Diagram. They determine the type of algebra problems designated in the Venn Diagram. This one-page worksheet contains 1 problem. The answer is provided at the...
Curated OER
Union and Intersection of Sets
In this Algebra I/Algebra II learning exercise, students determine the intersection and union of sets and solve problems with Venn diagrams. The three page learning exercise contains a combination of seventeen multiple choice and free...
Curated OER
Venn Diagram
In this algebra worksheet, students evaluate elements and show what they have in common using a Venn Diagram. They answer questions about the elements in each section. There are 9 questions without an answer key.
Mathematics Vision Project
Probability
Probability, especially conditional probability, can be a slippery concept for young statisticians. Statements that seem self-evident on the surface often require a daunting amount of calculations to explicate, or turn out to be not so...
Curated OER
Logic Quiz
In this algebra worksheet, students review grouping like terms using a Venn Diagram. They compare and contrast between like terms and unlike terms. There are 6 problems with an answer key.
Curated OER
Model and Solve Algebraic Equations
Examine multiple ways to solve algebraic equations. Pupils will generate a problem solving strategy that addresses the prompt given by the teacher. They will then share their problem solving strategy with the class. Graphic organizers,...
Math Stars
Math Stars: a Problem-Solving Newsletter Grade 7
Put on your thinking caps because middle school math has never been more interesting in this huge resource full of thought provoking questions. Written as a newsletter, the resource has 10 two-page newsletters with a variety of...
Curated OER
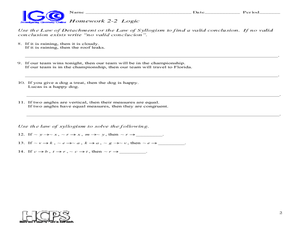
Logic Homework
In this algebra worksheet, students use Venn diagrams to differentiate between rational and irrational numbers. They solve word problems using algebraic expressions. There are 14 questions.
Curated OER
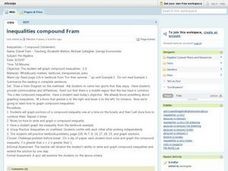
Inequalities Compound Fram
Students practice graphing compound inequalities. They draw a Venn Diagram on two different sports visualizing that their is a middle section on commonality among the two sports groups and then relate that concept to compound inequalities.
Curated OER
Analyzing Graphs and Data
Students collect and analyze data. In this statistics lesson, students graph their data and make inferences from the collected data. They display their data using graphs, bar graphs, circles graphs and Venn diagrams.
Curated OER
Blood Types
In this algebra worksheet, students examine the 4 different blood types, and make a graph deciding which blood types are compatible with each other when it comes to donors. There are 9 questions with an answer key.
EngageNY
Probability Rules (part 2)
Ensure your pupils are rule followers! Learners add the addition rule to the set of probability rules examined in the previous lesson. Problems require both the multiplication and addition rule.
Virginia Department of Education
Inductive and Deductive Reasoning
Introduce pupils to the two types of reasoning, inductive and deductive. Classmates work in pairs or small groups to learn the difference between the two and apply these reasonings to develop valid conclusions.
Curated OER
Quilting Geometry
Study geometry through the concept of quilt design. High schoolers examine the geometric shapes in various quilts and then create their own quilts using geometric shapes that fit together. In the end, they write a paragraph to describe...
Curated OER
Choose or Lose: The Electoral Process
Pupils examine the local and national election process. In groups, they brainstorm a list of the issues important to them and compare them to an overall list of issues present in the election. They analyze graphs and complete...


