EngageNY
The Distance from a Point to a Line
What is the fastest way to get from point A to line l? A straight perpendicular line! Learners use what they have learned in the previous lessons in this series and develop a formula for finding the shortest distance from a point to a...
EngageNY
Equations for Lines Using Normal Segments
Describing a line using an algebraic equation is an essential skill in mathematics. The previous instructional activity in the series challenged learners to determine if segments are perpendicular with a formula. Now they use the formula...
EngageNY
Criterion for Perpendicularity
The Pythagorean Theorem is a geometry pupil's best friend! Learners explain the equation a1b1 + a2b2 = 0 for perpendicular segments using the Pythagorean Theorem. They are able to identify perpendicular segments using their endpoints and...
EngageNY
Designing a Search Robot to Find a Beacon
Build right angles using coordinate geometry! Pupils explore the concept of slope related to perpendicular lines by examining 90-degree rotations of right triangles. Learners determine the slope of the hypotenuse becomes the opposite...
Charleston School District
Analyzing Scatter Plots
Scatter plots tell a story about the data — you just need to be able to read it! Building from the previous lesson in the series where learners created scatter plots, they now learn how to find associations in those scatter plots. They...
Charleston School District
Pre-Test Unit 9: Scatter Plots
What do your classes know about statistics? Use a pre-test to determine their background. Topics include scatter plots and lines of best fit, two-way frequency tables, and modeling with linear equations.
Charleston School District
Review Unit 6: Systems of Equations
It's time to show off what they learned! The final lesson in the series is a review worksheet on the topics learned throughout the unit. Scholars solve systems of equations using graphic and algebraic methods, solve system-based word...
Charleston School District
Solving Systems by Inspection
Can you solve a system by just looking at it? The previous lessons in the series taught three methods of solving systems of equations. Now learners discover they can determine the number of solutions of a system just by looking at it....
Charleston School District
Solving Systems Graphically
When guess and check gets old, it's time to start graphing! An instructive lesson explains how to solve a system of linear equations using graphing. Equations are in both slope-intercepts and standard form.
Charleston School District
Pre-Test Unit 6: Systems
As if solving equations with an x isn't tricky enough, now they add a y, too? A pre-assessment gauges the knowledge of your classes related to systems. They are asked to solve graphically and algebraically and to solve word problems.
Charleston School District
Tables of Linear Functions
Don't forget the tables! The previous lessons in this five-part series examined the linear equation and graph relationship. The current lesson adds tables to the mix. At completion, individuals should be able to create a table of values,...
Charleston School District
Pre-Test Unit 4: Linear Funcitons
Let your classes show you what they know! Use this pre-test to assess the current knowledge of your learners. The assessment includes all pre-algebra concepts related to functions: writing and graphing linear relationships, comparing...
Curated OER
Caterpillars and Climate: How Temperature Affects Feeding Rate In Insects
Do you eat more when you are hot or when you are cold? Young scientists observe the eating pace of two caterpillars at different temperatures. The differences in endotherm and ecotherm animals' ability to adjust to temperature change...
Charleston School District
Review Unit 3: Functions
Time to show what you know about functions! The review concludes a series of nine lessons on the basics of functions. The problems included are modeled from the previous lessons. Pupils determine if a table represents a function,...
Charleston School District
Graphing Functions
How do letters and numbers create a picture? Scholars learn to create input/output tables to graph functions. They graph both linear and nonlinear functions by creating tables and plotting points.
Charleston School District
The Sum of Angles in a Triangle
An informative lesson contains a brief explanation of how the sum of the angles of a triangle is a line. The lesson continues with determining the missing angle in a triangle, or solving for a variable. Using the sum of the angles, the...
Charleston School District
Transformation Basics
Transformations are more than the process in which sports cars become fighting robots. Listed in terms of which transformations give congruent or similar figures, several resources provide definitions and examples of the four basic...
Charleston School District
Constructing Scatter Plots
Having more letters in your name helps you get a better grade in your math class—or does it? Learners create scatter plots to organize data. The lesson places emphasis on determining scale and intervals and labeling axis.
Charleston School District
The Distance Between Points
Find the shortest distance from A to B using the Pythagorean Theorem! Scholars learn they can find the distance between two points by creating a right triangle using the horizontal and vertical lengths and applying the Pythagorean Theorem.
Charleston School District
Graphing with Slope-Intercept Form
Work on graphing linear equations using the provided materials. The print and video lesson thoroughly review the concepts related to graphing linear equations in slope-intercept and standard form. The materials prepare learners for the...
Charleston School District
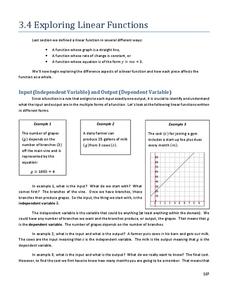
Exploring Linear Functions
What does a graph or equation say about a situation? Lots! The lesson uses the concepts explored in the previous four lessons in the series and applies them to problem solving situations. Learners create an equation from problems posed...
Charleston School District
Intro to Functions
How are functions related to chicken nuggets? A video teaches the concept of a function using the idea of a nugget-making machine as an analogy for a function machine. Learners determine if a relation is a function from an equation and a...
Charleston School District
Graphs of Linear Functions
What does a slope of 2/3 mean? Develop an understanding of the key features of a linear function. Pupils graph the linear functions and explain the meaning of the slope and intercepts of the graphs.
Charleston School District
Pre-Test Unit 3: Functions
How does an input affect an output? Assess your learners' ability to answer this question using this pre-test. Scholars answer questions about the basics of a function. Topics include determining if a table or statement represents a...


