Curated OER
Equilibrium Prices And Equilibrium Quantities
In this economics instructional activity, students plot data regarding the demand for the supply of a product and answer 6 detailed fill in the blank/multiple choice questions regarding market prices and quantities.
Curated OER
Economics Study Guide
In this economics instructional activity, students answer a variety of fill in and short answer questions, draw a diagram to illustrate the circular flow of economic activity, and write short essays to address prompts.
Curated OER
The Kinked Demand Curve of an Oligopolist
In this Kinked Demand Curve worksheet, students read a brief introduction, then examine and curve and answer questions about it.
Curated OER
Demand curves, Moves Along Demand Curves, and Shifts in Demand Curves
In this economics instructional activity, students study a data chart, plot the demand of a hypothetical product, and complete 3 fill in the blank questions. They then study two more demand charts and respond to 3 multiple choice...
Curated OER
Graphing Systems of Inequalities
In this graphing systems of inequalities worksheet, students solve and graph 8 systems of inequalities. One problem includes an absolute value.
Curated OER
Systems of Inequalities
In this graphing systems of inequalities worksheet, students solve and graph 4 inequalities with the help of a computer. Students solve 2 more systems of inequalities using the calculator.
Curated OER
Graphing Systems of Inequalities
In this systems worksheet, students solve 6 systems of inequalities by graphing. Students then write 1 systems of inequalities for a given graph.
Curated OER
Graphing Linear Equations
In this linear equations worksheet, students graph 2 linear equations using x- and y- intercepts. Students then graph 2 additional equations using the slope and y-intercept method.
Curated OER
Graphing 3 Ways
In this graphing activity, students graph 10 equations using the following methods: slope-intercept form, x- and y-intercepts, or by using a table. Students check their work using a graphing calculator.
Curated OER
Graphing Inequalities
In this graphing inequalities activity, students complete 8 inequality tables. Students then graph and shade the 8 inequalities on a coordinate plane.
Curated OER
Particular and Homogeneous Solutions
In this homogeneous and general solutions worksheet, students solve and graph 4 different types of equations related to particular solutions. They determine the general solution to each of the 4 homogeneous equations and the solution of...
Curated OER
Two-sided Confidence Interval for a Population Proportion
In this two-sided confidence interval instructional activity, students solve 3 problems to include constructing a confidence interval for a population proportion with a large sample. First, they split the confidence and shad its...
Curated OER
Normal Curve Areas
In this normal curve areas worksheet, learners follow 6 steps to compute probability regarding possible sample means using a large sample. First, they label the scale with the mean and corresponding standard deviations. Then, students...
Curated OER
Normal Curve Areas - Population
In this normal curve areas learning exercise, students follow 6 steps to compute the probability regarding the values from the population. First, they label x-scale with the mean and corresponding standard deviations and shade the...
Curated OER
Normal Curve Areas
In this normal curve areas worksheet, students follow 6 steps to compute the probability regarding the possible sample of proportions using a large sample population. First, they label the Ps-scale with the proportion and corresponding...
Curated OER
Integers
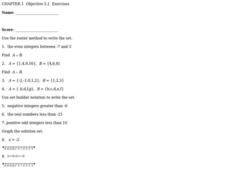
In this integers worksheet, students solve 10 different problems relating to integers. First, they use the roster method to write each set of even integers. Then, students use set builder notation to write the set of negative integers,...
Curated OER
Graphing Inequalities
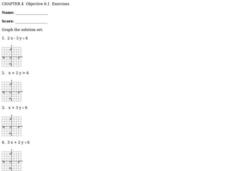
In this graphing inequalities worksheet, students solve and graph the solution set for eight inequalities. They first solve each inequality, either for x or for y, then they plot the coordinates found on the graph provided for each...
Curated OER
Slope of a Line
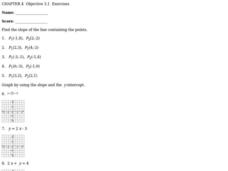
In this slope of a line activity, students solve ten problems determining the slope of points and an equation. First, they find the slope of the line containing the two points given in the first five problems. Then, students graph the...
Curated OER
Graphing Linear Equations
For this graphing worksheet, students graph ten linear equations on each of the graphs provided. They first plug in some values to the given equation using a T-chart. This will give them their coordinates to use on the graph and form...
Curated OER
Chapter 5 - Objective 5.1 Linear Equations
In this linear equations worksheet, students graph linear equations and identify the domain and range of each function. This one-page worksheet contains five problems.
Curated OER
Hot Wheelin' Physics
In this physics worksheet, students complete a lab activity and record their results in the charts shown. They calculate the speed for each trial using the total time and total distance. Students also graph their results.
Curated OER
Graph Paper
For this literacy worksheet, students are asked to complete the graphing activities using the newly created worksheets. The sheet itself is a guide for teachers to create graph paper styles.
Curated OER
Asymmetric Graph Paper
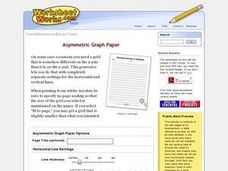
In this literacy worksheet, students use the created asymmetrical graph paper for class activities. The sheet is intended to be a teacher's guide.
Curated OER
Axis Graph Paper
In this literacy worksheet, students use the axis graph paper that is created using this worksheet. The sheet is a teacher's guide.


