Curated OER
The Random Walk II
Deep mathematical thinking is found with just a coin and a number line. Combining computing some probabilities in a discrete situation, and the interpretation of a function, this simple task gives learners a lot to think about on their...
EngageNY
Distance and Complex Numbers 2
Classmates apply midpoint concepts by leapfrogging around the complex plane. The 12th instructional activity in a 32 segment unit, asks pupils to apply distances and midpoints in relationship to two complex numbers. The class develops a...
EngageNY
Chance Experiments
Class members are introduced to probability using terms such as impossible, unlikely, likely, and certain. Numbers between zero and one are associated with the descriptions of probability. Pupils find the likelihood of chance experiments...
EngageNY
Percent of a Quantity
Visualize methods of finding percents. Classmates find a percent of a quantity using two methods including a visual model in the 26th lesson in a series of 29. By the end of the lesson, scholars find percents given a part and the whole...
EngageNY
Two Graphing Stories
Can you graph your story? Keep your classes interested by challenging them to graph a scenario and interpret the meaning of an intersection. Be sure they paty attention to the detail of a graph, including intercepts, slope,...
Statistics Education Web
Saga of Survival (Using Data about Donner Party to Illustrate Descriptive Statistics)
What did gender have to do with the survival rates of the Donner Party? Using comparative box plots, classes compare the ages of the survivors and nonsurvivors. Using the same method, individuals make conclusions about the gender and...
EngageNY
Interpreting and Computing Division of a Fraction by a Fraction—More Models
Use a unit approach in developing a fraction division strategy. The teacher leads a discussion on division containing units, resulting in a connection between the units and like denominators. Pupils develop a rule in dividing fractions...
American Statistical Association
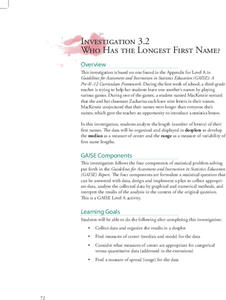
Who Has the Longest First Name?
Name that statistic! Classmates each write their name and the number of letters in it on a sticky note to place on the board. As a class, they determine the median, mode, and range of the name lengths, and create a dot plot of the data....
Illustrative Mathematics
1.OA, NBT, The Very Hungry Caterpillar
First graders are exposed to addition of three whole numbers in a math activity centered around Eric Carle's, The Very Hungry Caterpillar. As the teacher reads, young mathematicians use counters and ten-frames to symbolize the number of...
Curated OER
Rounding and Subtracting
Common Core is all about getting your learners to open their minds and think about the why and how. This problem has them thinking about unknown numbers and their relationship with one another when we round and subtract. They will have...
Mathematics Assessment Project
Interpreting Distance–Time Graphs
Pre-algebra protégés critique a graph depicting Tom's trip to the bus stop. They work together to match descriptive cards to distance-time graph cards and data table cards, all of which are provided for you so you can make copies for...
Virginia Department of Education
Constructions
Pupils learn the steps for basic constructions using a straightedge, a compass, and a pencil. Pairs develop the skills to copy a segment and an angle, bisect a segment and an angle, and construct parallel and perpendicular lines.
02 x 02 Worksheets
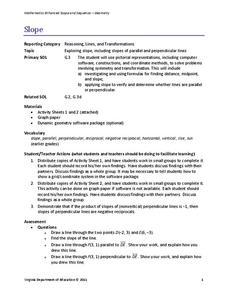
Slope
What does slope have to do with lines? Pupils work with lines and determine the slope of the lines informally and with the slope formula. Groups use their knowledge to calculate the slopes of parallel and perpendicular lines. They also...
Virginia Department of Education
Linear Curve of Best Fit
Is foot length to forearm length a linear association? The class collects data of fellow scholars' foot length and the length of their forearms. They plot the data and find a line of best fit. Using that line, they make predictions of...
American Statistical Association
What Fits?
The bounce of a golf ball changes the result in golf, mini golf—and a great math activity. Scholars graph the height of golf ball bounces before finding a line of best fit. They analyze their own data and the results of others to better...
Teach Engineering
The Challenge Question
A research position becomes a modeling job. The introductory lesson in a series of nine presents the challenge of analyzing a set of bivariate data. The class brainstorms what the data may represent. Pupils must decide what is needed to...
Statistics Education Web
Text Messaging is Time Consuming! What Gives?
The more you text, the less you study. Have classes test this hypothesis or another question related to text messages. Using real data, learners use technology to create a scatter plot and calculate a regression line. They create a dot...
West Contra Costa Unified School District
Sneaking Up on Slope
Pupils determine the pattern in collinear points in order to determine the next point in a sequence. Using the definition of slope, they practice using the slope formula, and finish the activity with three different ways to determine the...
Mathalicious
Three Shots
To foul or not to foul, that is the basketball question. High schoolers look at the probability that fouling out a player and allowing free throws yields a better outcome than allowing the original shot. The resource provides a teacher's...
EngageNY
Geometric Interpretations of the Solutions of a Linear System
An intersection is more than just the point where lines intersect; explain this and the meaning of the intersection to your class. The 26th segment in a 33-part series uses graphing to solve systems of equations. Pupils graph linear...
EngageNY
Getting a Handle on New Transformations 2
Use 2x2 matrices to move along a line. The second day of a two-day activity is the 28th installment in a 32-part unit. Pupils work together to create and solve systems of equations that will map a transformation to a given point. The...
Illustrative Mathematics
Roll & Build
Develop young mathematicians' understanding of place value with this hands-on math activity. Working in pairs, learners take turns building two-digit numbers by rolling two ten-sided dice. Base ten blocks are then used to model the...
Curated OER
Add and Subtract
Like the cubs in A Fair Bear to Share, your 2nd grade class will practice adding and subtracting double-digit numbers by grouping, regrouping, and sorting a collection of objects. This requires many resources, but it is well worth the...
EngageNY
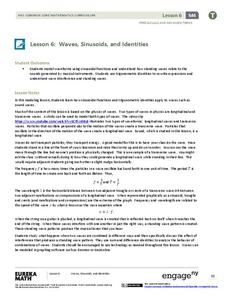
Waves, Sinusoids, and Identities
What is the net effect when two waves interfere with each other? The lesson plan answers this question by helping the class visualize waves through graphing. Pupils graph individual waves and determine the effect of the interference...
Other popular searches
- Fractions on a Number Line
- Fractions Number Lines
- Integer Number Line
- Grade One Linear Measurement
- Rounding With Number Lines
- Double Number Lines
- Number Line Addition
- Fraction Number Lines
- Decimals on a Number Line
- Intersection of Two Lines
- Number Line Graphs
- Two Step Linear Equations


