Curated OER
Extraordinary Extrapolation
Students study how scientists have estimated the maximum height to which trees can grow, and assess the reliability of interpolation and extrapolation techniques by making predictions with particular data sets and analyzing accuracy of...
Curated OER
US Households
Learners construct and use inverse functions to model a real-world context. They use the inverse function to interpolate a data point.
Texas Instruments
Sands of Time
Twelfth graders explore an application of integration. A calculus lesson prompts class members to find the length of the day where they live during the winter and summer solstice. Using data relating to the solstices at various...
Curated OER
Dinosaur Tracks: From Stride To Leg Length To Speed
Students determine the relationship between leg length, stride length, and speed in humans and bipedal dinosaurs. They collect data and graph these human characteristics then use actual data collected from dinosaur track pads and fossils...
Curated OER
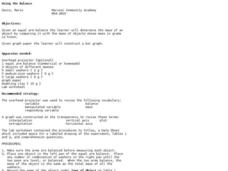
Using the Balance
Students determine the mass of various objects. In this integrated math and science lesson, students use an arm balance to compare a known object to a combination of washers with a fixed weight. Students record data, construct a bar...
Curated OER
Point Graphs
Students experiment with point graphs. In this math lesson, students are divided into groups and perform an experiment to see how high a ball bounces, recording their results on a point graph. Students then answer provided questions.
Curated OER
Track's Slippery Slope
Learners graph data of sports figure running time using x-axis y-axis to find slope of trend line, mathematically find the interpolated and extrapolated values for data points. Using the information they make predictions.
Rochester Institute of Technology
Skateboard Performance Testing
Perform an activity on performance testing with a lesson focused on the purpose of wheel bearings on skateboards. Learners conduct performance testing on a skateboard to collect and interpret data.
Alabama Learning Exchange
Bloodstain Pattern Doesn't Lie......
An interesting instructional activity on hypothesizing about the diameter of a drop of blood that is splattered. To test their theories, learners work in groups to make blood droplets splatter from different heights. They use graphed...
Space Awareness
Valleys Deep and Mountains High
Sometimes the best view is from the farthest distance. Satellite imaging makes it possible to create altitude maps from far above the earth. A three-part activity has your young scientists play the role of the satellite and then use...
Kenan Fellows
How Does an Unhealthy Diet Influence our Health and Well-Being?
You are what you eat, or so they say! After surveying family and friends on a week of eating habits, learners analyze the data for patterns. They compare different variables such as fats and cost, fats and calories, or fats and LDLs.
Curated OER
Examine Methods of Reporting Research Results
Students analyze a research report and the list of components needed in a research report and then identify those components based on a set of standards using the scientific method. They collect data which can be used for a graphical...
Curated OER
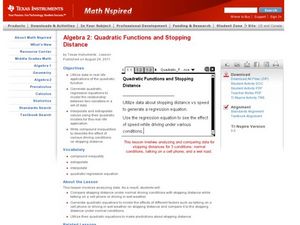
Quadratic Functions and Stopping Distance
Learners solve quadratic equations. In this algebra lesson, students factor and graph quadratic functions. they use the properties of quadratics to calculate the distance.
Curated OER
Colorimetric Determination of the Concentration of Blue Food Coloring in Sport Drinks
Seventh graders determine the amount of blue food coloring in sports drinks and plot the concentration and absorbance data. They summarize the data and determine why companies need to know the amount of chemicals in their products.
Curated OER
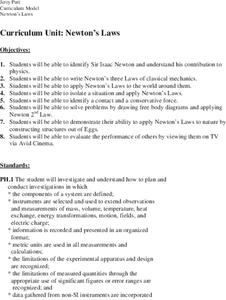
Newton's Laws
Students examine and discuss Newton's Laws and discover his contribution to physics. In groups, they participate in an experiment in which they much apply the Laws to the world around them. They describe contact and conservative forces...
Curated OER
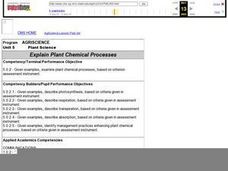
Explain Plant Chemical Processes
Students discover plant chemical processes through three lab activities. Overheads, data sheets, and teaching procedures provided for the unit covering photosynthesis, respiration, and transpiration.
Curated OER
Survey Project
Eighth graders create a website using FrontPage. They use inserted forms to collect survey information and use Microsoft Excel and MS Word to create a presentation of the survey and the results.
Curated OER
PLANETS IN PROPORTION
Students discover scales for both the solar bodies' relative sizes and their distances from the sun. They find equatorial circumference and volumes of their solar bodies. Students apply estimation strategies and proportioanl reasoning to...
Curated OER
Investigating Linear Equations Using Graphing Calculator
Students investigate linear equations using the Ti-Calculator. In this algebra activity, students graph lines and identify the different quadrants on a coordinate plane. They identify ordered pairs used to plot lines.
Curated OER
How Do They Relate? Linear Relationship
Students collect information and use a line to represent it. In this algebra lesson, students investigate real world data to see if it makes a line. They graph the line comparing the relationship of the x axis with that of the y axis.
Curated OER
Investigate Factors Affecting Nitrates in Groundwater
Students participate in an experiment in which they investigate the factors affecting the levels of nitrates in groundwater. Using examples, they explain the nitrogen cycle and identify the sources of chemical nitrogen fertilizers. ...
Curated OER
Manage Soil
Students identify and classify soil ypes according to data on the soil triangle. Given examples, students identify soil conservation practices, using criterion assessment instrument. When giving a case situation involving soil...
Curated OER
Bungee Man Lab
Students explore the motion of a toy bungee jumper using the scientific method. They view a video of a bungee jumper and discuss what can be measured about a bungee jump. Students discuss the scientific mehtod and how to design an...
Curated OER
Determining A Spring Constant
Students determine a spring constant and extrapolate information from a graph. In this spring lesson plan students divide into groups and complete a lab activity.
Other popular searches
- Linear Interpolation
- Interpolation of Data
- Extrapolation Interpolation
- Polynomial Interpolation
- Accurate Point Interpolation
- Interpolate Volcanism
- Higher Degree Interpolation


