EngageNY
Comparing Rational Expressions
Introduce a new type of function through discovery. Math learners build an understanding of rational expressions by creating tables and graphing the result.
Education Development Center
Creating a Polynomial Function to Fit a Table
Discover relationships between linear and nonlinear functions. Initially, a set of data seems linear, but upon further exploration, pupils realize the data can model an infinite number of functions. Scholars use multiple representations...
Project Maths
Introduction to Patterns
The world is full of patterns. Help learners quantify those patterns with mathematical representations. The first Algebra lesson in a compilation of four uses a series of activities to build the concept of patterns using multiple...
Curated OER
Worksheet 3.1 Functions
Middle and high schoolers complete and solve 12 various types of problems. First, they express the output as a function of the input in each table. Then, pupils evaluate for the given variable when the value is as stated. In addition,...
5280 Math
Aquarium Equations
Take a look at linear functions in a new environment. A three-stage algebra project first asks learners to model the salt concentration of an aquarium using linear functions. Then, using iterations, pupils create a set of input-output...
Curated OER
Making Connections
Eighth graders investigate the input/output model for building function tables. From the data, 8th graders connect tables, graphs, function rules, and equations in one variable. They work backwards to determine function rules for given...
EngageNY
The Height and Co-Height Functions of a Ferris Wheel
Show learners the power of mathematics as they model real-life designs. Pupils graph a periodic function by comparing the degree of rotation to the height of a ferris wheel.
Curated OER
Function Tables
Students identify function using tables of data. In this algebra instructional activity, students create a tale of point and plot on a coordinate plane. They analyze the graph as being a function or not.
EngageNY
Solution Sets to Equations with Two Variables
Can an equation have an infinite number of solutions? Allow your class to discover the relationship between the input and output variables in a two-variable equation. Class members explore the concept through tables and graphs and...
West Contra Costa Unified School District
Writing Exponential Functions Based on Data
Give your class a concrete example of exponential growth and decay using this hands-on activity. These Algebra II lessons allow for the exploration of exponential growth and decay models, as well as the discovery of the patterns of each....
Virginia Department of Education
Growing Patterns and Sequences
Learners explore, discover, compare, and contrast arithmetic and geometric sequences in this collaborative, hands-on activity. They build and analyze growing patterns to distinguish which kind of sequence is represented by a set of data...
Curated OER
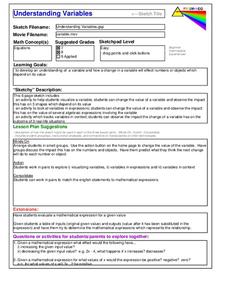
Understanding Variables
Students solve linear equations and identify the unknown. In this algebra lesson, students define a variable and use addition, subtraction, multiplication and division to solve. They change the equation depending on the value of the...
Curated OER
Mine Shaft Grade 8 Slope
Eighth graders investigate slopes using real life scenario. For this algebra lesson, 8th graders model and interpret real life data. They plot their data in a coordinate plane and discuss the results with the class.
Curated OER
Relations and Functions
Students differentiate between a relation and a function. In this algebra instructional activity, students identify a pair of coordinates as being a relation or a function. They analyze graphs for function as they solve word problems.
Curated OER
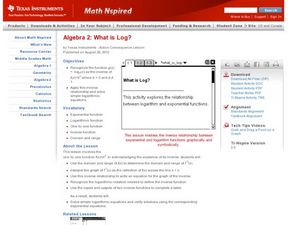
What is Log?
Young mathematicians differentiate between logs and natural logs in this algebra lesson plan. They solve functions and logarithmic functions. Learners also graph and rewrite the exponential and log functions.
Curated OER
Functions and Their Graphs.
Students solve equations and label it as a function or not. In this algebra lesson, students make a table of values and graph their equation. They identify the domain and range of each graph.
Curated OER
Graphing Linear Equations with Calculator
Students graph lines using the calculator. In this algebra lesson, students graph lines of equations in the form y=mx+b. They input equations into the TI Calculator and graph using the slope and intercept. They analyze the graph for...
Curated OER
Introduction To Functions
Students define a functions and solve problems using functions. In this algebra lesson, students differentiate functions from non-functions. They differentiate between polynomials of higher degrees.
Curated OER
How are we Related?
Students differentiate functions based on their domain and range. In this algebra lesson, students define function, domain, range and relation. They analyze graphs and coordinate pairs for input and output values making up a function.
Curated OER
Variables and Patterns: Determining an appropriate scale while graphing
Sixth graders determine appropriate scales when graphing data. In this graphing lesson plan, 6th graders use an the applet "Graph It" to determine what is an appropriate scale for their data.
Virginia Department of Education
Independent and Dependent Variables
Investigate the relationship between independent and dependent variables. Individuals begin by identifying independent and dependent variables from different problem situations. Then, using specific guidelines, they create posters...
Mathematics Vision Project
Module 8: More Functions, More Features
A piece of this and a piece of that, add domain restrictions and create a piecewise function. Young scholars explore piecewise functions with and without context. Functions include both linear and quadratic parts. The module is the...
EngageNY
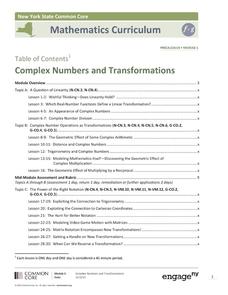
Complex Numbers and Transformations
Your learners combine their knowledge of real and imaginary numbers and matrices in an activity containing thirty lessons, two assessments (mid-module and end module), and their corresponding rubrics. Centered on complex numbers and...


