Curated OER
Gas Pressure, Volume, and Temperature
Physical science learners conduct a simple experiment using the heat of their hands to affect the fluid pressure. They place a balloon atop a freezing cold bottle and observe what occurs as it warms up. Both activities demonstrate how...
Curated OER
Gas Pressure and Volume
A class might find this presentation complicated at first, but with your explanations would understand the relevancy of the diagrams included. An animnated plunger shows the change in pressure on a gas and makes the reasoning behind the...
Curated OER
#24 How Much Air Is In Foamed Polystyrene Products?
Students are challenged to come up with a good estimate of the amount of air in foamed polystyrene products. They use this gas evolution experiment and as such have students measure the gas generated when foamed polystyrene is degassed...
Curated OER
The Ideal Gas Law
In this gas law worksheet, students apply the Ideal Gas Law by determine the volume, mass, or pressure of the given gases. This worksheet has 5 problems to solve.
Curated OER
Gases Worksheet
This worksheet focuses on calculations involving gases. The learners will be solving for the number of molecules, gas pressure, partial pressures, and volumes of different gases.
Curated OER
Gas Laws
For this gas worksheet, students practice using the gas laws to calculate volume, pressure, or temperature of gases in 12 different word problems.
Curated OER
Ideal Gas Law
In this Ideal Gas Law worksheet, students use the Ideal Gas Law to solve each of the problems listed. They calculate the volume of moles of a gas that occupy at a specific temperature. Students also find the volume of moles of gas whose...
Curated OER
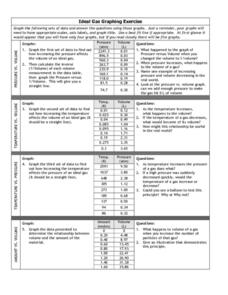
Graphing Exercise of Ideal Gas Data
In this graphing of Ideal Gas Data activity, students use the given data to draw 4 graphs of the given data. They are given the pressure and volume to draw and interpret the graphs.


