Curated OER
Introduction to Representing and Analyzing Data
Represent data graphically. Allow your class to explore different methods of representing data. They create foldables, sing songs, and play a dice game to reinforce the measures of central tendency.
Curated OER
Building Brilliant Bar Graphs
Everything you need for a mini-unit on bar graphs is included in this lesson plan! It outlines three lessons and includes worksheets. Learners taste pretzels, shoot baskets (switching off hands), and grab candy, graphing results...
Curated OER
Data Squares
Middle and high schoolers examine how data squares organize and sort information and data sets. They discuss examples of data squares, complete a data square about themselves, organize the data squares for the class together, and compile...
Curated OER
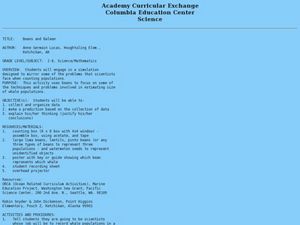
Beans and Baleen
Predict whale populations using different beans as whales! Learners observe different types of beans in a dish knowing that each bean represents a different kind of whale. They then predict how many "whales" there are in a certain area....
Curated OER
Can You Count on Cans?
How can a canned food drive be connected to math? It's as simple as counting and organizing the cans! Children demonstrate their ability to sort non-perishable foods into categories that include soup cans, vegetable cans, boxed items,...
Curated OER
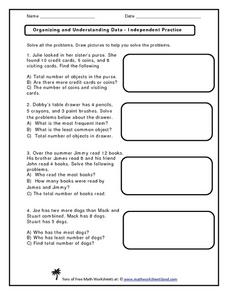
Organizing and Understanding Data - Independent Practice
Provide your first graders with an opportunity for independent practice organizing and understanding data. The ten story prompts on this three-page activity asks learners to solve problems involving concepts of the total number of...
Curated OER
Probability
Here is a classic activity used to introduce your class to the concept of probability and data collection. They will roll one die 30 times, then record and discuss the results. Great introduction, but too shallow to be considered a...
Curated OER
When is Your Birthday?
Students use data about their birthdays to create graphs. In this collecting and communicating information instructional activity, students make a class list of their birthdays. Students use the information to make a bar graph showing...
Curated OER
What's My Pattern?
Students recognize, describe and extend patterns in three activities. They organize data, find patterns and describe the rule for the pattern as well as use the graphing calculator to graph the data to make and test predictions. In the...
Curated OER
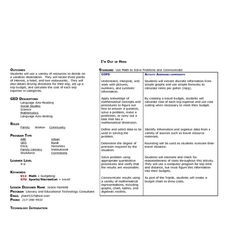
I'm Out of Here
Students create a travel budget. In this budget lesson, students research vacation destinations. Working independently, students research destinations on the Internet and construct a budget for the vacation. Resources provided.
Pennsylvania Department of Education
Eye to Eye
Students practice the concept of posing mathematical questions regarding themselves and their surroundings. In this eye to eye lesson plan, students gather data about eye color from their classmates. Students organize their data in order...


