Curated OER
Sampling Bias And the California Recall
Using a 2002 California Gray David recall vote as an example, young statisticians identify sources of bias in samples and find ways of reducing and eliminating sampling bias. They consider ways to select random samples from a...
Curated OER
Project Conclusion
In this cells activity students answer questions regarding the characteristics of living organisms observed during a pond water survey. Students draw diagrams of a food chain.
Curated OER
Calculating and Applying Basic Probability
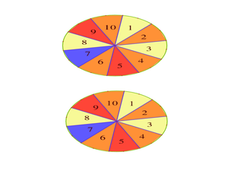
Eighth graders investigate the basic concepts of probability. For this probability lesson, 8th graders learn the associated probability. They work with spinners, colored cubes in a bag, flip coins, and choose colored candies while they...
Curated OER
Insect Collection
High schoolers explore how to use several types of insect sampling and collectin equipment. They work in groups to collect insects in different areas of their schoolyard. Students are explained that quadrats are generally used to...
Curated OER
How Many Blades of Grass in a Football Field?
Learners, by taking a sample count from a small area, estimate the total number of blades of grass in a football field. They use a cardboard from, the inside of which measures 1 square foot to do their calculations.
Curated OER
Making Blood!
Ninth graders study facts about human blood and what it is made of. In this blood composition lesson students divide into groups and complete several activities.
Curated OER
Sampling Rocks
Learners study rocks they find on the playground. In this investigative instructional activity students collect and analyze rocks they find and answer questions about them.
Curated OER
Recognizing Bias in Graphs
In this bias in graphs worksheet, students examine graphs and explain the data. They determine why the graph is or is not biased. This four-page worksheet contains approximately 6 problems. Explanations and examples are provided.
Curated OER
Questionnaires and Analysis
In this questionnaires and analysis worksheet, students design a questionnaire and then select a sample. They organize and analyze data. This four-page worksheet contains 1 multi-step problem. Explanations and examples are provided.
Curated OER
Sampling
For this sampling worksheet, students collect samples concerning the heights of classmates. They determine the mean height for the population. This two-page worksheet contains 4 problems.
Curated OER
Business & Statistics: Final Exam
In this business and statistics worksheet, students read real-life business problems, arrange data, and identify the probability method best used to determine the answer. They identify the type of random sample, draw stem-and-leaf plots,...
Curated OER
Normal Curve Areas
In this normal curve areas worksheet, learners follow 6 steps to compute probability regarding possible sample means using a large sample. First, they label the scale with the mean and corresponding standard deviations. Then, students...
Curated OER
Copyright, Sampling and Mashing
Students examine copyright laws in regard to sharing, sampling and mashing music. After listening to pieces of music, they create their own music sample by combining musical elements and expression. Students visit a specified website...
Curated OER
Significant Science: Statistics for Planet Earth
Ninth graders discover how statistics are used to interpret results of scientific experiments. Students write hypotheses and test the hypotheses by collecting data and organizing the data. Students graph their data to produce a visual....
Curated OER
One Square Meter
Students explore the concept of a quadrat study. Students select and investigate a site and conduct a quadrat survey. They take measurements, observe the area and analyze their findings.
Curated OER
Observing the Evidence
Fifth graders explore how to do research from a large group. They explore how to choose a representative sample and collect data from it.
Curated OER
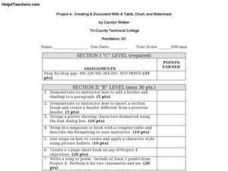
Creating A Document With A Table, Chart, and Watermark
Young scholars demonstrate to instructor how to add a border and shading to a paragraph. They also insert a section break and create a header different from a previous header.
Students design a poster showing characters formatted using...
Curated OER
Spring Collecting and Identifying Bumble Bees
Students collect bumble bees in the field, record data, pin and label specimens, answer conclusion questions, and send specimens to research leaders for verification. They improve their ability to work in research teams. Students...


