Curated OER
Integration: Statistics, Measures of Central Tendency
Learners find the mean, median, and mode for each of four data sets. They are given two line plots, and compute the median and mode of the shown data. They find the median and mode for three stem and leaf plots. They solve two word...
Curated OER
Line Plots - Homework 6.3
Elementary schoolers use data in a table to make a line plot, then answer five related questions. Houghton Mifflin text is referenced.
Curated OER
Introduction to Statistics: Mean, Median, and Mode
Students explore the concepts of mean, median, and mode. They develop an understanding and familiarity with these concepts. Students explore mean and median in an efficient way. Students explore three different measures of center.
Curated OER
Mean, Median and Mode (I)
In this online math worksheet, find the mean, median, and mode in a variety of sets of data. This excellent resource allows the students to check their answers, and to get "hints" should they run into difficulties. A terrific teaching tool!
Curated OER
Mean, Median, Mode, and Range - Homework 14.3
In this data and statistics activity, students find the mean, median, mode, and range of 4 different sets of data. Next, students solve 1 word problem where they find the mean.
Curated OER
How Alike Are We?
Fourth graders find the range, mode, median, and mean for each of the data sets (height and shoe size). They discuss which measure of central tendency for each data set best represents the class and why. Students graph the shoe size and...
Curated OER
7th Grade Math Worksheet
In this integers worksheet, 7th graders solve 10 different problems that include various types of integers and graphs. First, they determine the sum of 3 consecutive integers. Then, students find the ratio between 2 areas of similar...
Curated OER
Digger and the Gang
Help online friends Digger and Sprat from the BBC series to solve math problems! In a series of activities, your class will use data sets to calculate measurements, averages, means, and probabilities. The class completes worksheets and...
Curated OER
All in the Family
Students use data to make a tally chart and a line plot. They find the maximum, minimum, range, median, and mode of the data. Following the video portion of the lesson, students will visit a Web site to test their data collection skills...
Curated OER
WebQuest: Thrills and Spills- Pick Your Park!
Students participate in a WebQuest in which they must determine which amusement park is the "median priced" park. Students visit park websites to accumulate prices for parking, activities, restaurants, and gift shops.
Curated OER
How Big Is Your Head?
Students explore measurement by measuring classmates' heads. They record their measurements and they put the measurements in order from smallest to largest. Students figure the mean, median, mode, maximum, minimum, and range of their...
Curated OER
Making Sense of the Census
Students problem solve the mean and median of agricultural data by completing a worksheet. They discuss the results of the statistical data.
Curated OER
Measures of Center
In this statistics worksheet, students find mean, median, and mode for 3 problems. They find the mean of summarized data in 2 problems.
Curated OER
Data Analysis: Graphs, Charts, Tables, Statistics
In this data analysis worksheet, students interpret data in 5 problems involving graphs, tables, and scatterplots. Students construct 1 stem and leaf plot and find the mean, median, and mode of a data set.
Curated OER
Special Ed. Resource
Ways to organize data is the focus of this math PowerPoint. Students view slides that define and give descriptions of a variety of graphs, and how mean, median, and mode are found. A good visual tool which should benefit almost all types...
Curated OER
Find the possible values for the Median
In this online math learning exercise, students find values for the median given a variety of sets of data. This excellent resource allows the students to check their answers, and to get "hints" should they run into difficulties. A...
Curated OER
Word Problems That Involve the Mean (II)
In this word problem instructional activity, learners examine real world problems. They compute the mean, median, and mode of given problems. This one-page instructional activity contains 5 multi-step problems. Answers are provided.
Math Mammoth
Mean, Median, and Mode One
In this mean, median, and mode learning exercise, students find the mean, median, and mode for different problems of money, weight, and more. Students complete 6 problems.
Curated OER
Global Statistics
Students determine statistics based on data. In this statistics lesson, students use data and record in charts. Students create graphs based on the statistics found.
Curated OER
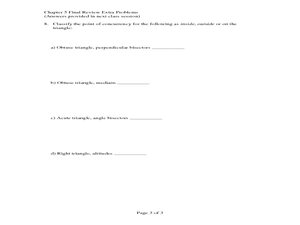
Chapter 5 Final Review Extra Problems. Triangles
In this triangles worksheet, students identify the median, altitude, segment, angle bisector, perpendicular bisector and triangle midsegment of triangles. They find the perimeter of triangles. This three-page worksheet contains 8...
Curated OER
Math Regents Exam Questions: Lesson 1-6 - Mean, Median, Mode and Range
In this mean and median worksheet, students examine given data and determine the measures of central tendency for the data. Students compute the mode, mean, median, and range of data. They create stem-and-leaf plots. This ten-page...
Curated OER
Triangle Island
Learners calculate the altitude of triangles. In the web based lesson, students explore the interior distance from a given point in a polygon to its side. They compute the sum of these lengths. Learners read life application problems...
Curated OER
Take a Walk
Sixth graders graph acceleration and practice using the metric system. In this physics lesson, 6th graders take turns timing each other as they walk 15 meters. Students then chart and graph their data using the metric system.
Curated OER
Mean, Median, Mode and Range
Fourth graders investigate when to find the mean, median, mode and range. In this statistical concepts lesson, 4th graders collect data, make observations and graph the data. Students verify their work on the computer.


