Curated OER
Percent
In this percent worksheet, students change the number of a percent to a fraction. Students complete 10 problems where they change a percent to a fraction.
Curated OER
Percent
In this converting decimals to percents worksheet, students are given ten problems where they start with a decimal and are required to change the decimal to a percent. There is an answer sheet provided.
Curated OER
Percent Worksheet 15
In this percent instructional activity, students calculate the percentages of two and three digit numbers. Students complete 18 problems where they calculate percentages.
Curated OER
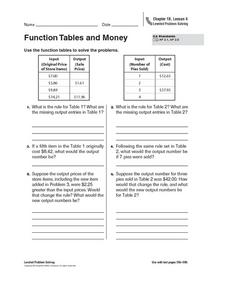
Function Tables and Money
In this function tables, money worksheet, students examine 2 different function tables, where they are given input information. Students determine the rule of the function table, then calculate the missing output values. The first table...
Curated OER
Penny Lab
In this percent composition worksheet, students carry out an experiment to determine the percent of zinc in a penny. They write a balanced equation for the chemical reaction they performed with the penny and hydrochloric acid.
Curated OER
Slopes for the Mathematically Inclined
In this slope worksheet, 9th graders solve and complete 6 different problems that include completing charts and applying applications to the real world. First, they use the pictures shown to measure the riser and tread of 3 consecutive...
Curated OER
Decimals, Percent and Scientific Notation
In this decimals, percent and scientific notation worksheet, 9th graders solve various types of problems that range from shading an indicated part of a shape to calculating using scientific notation to express their answer. They express...
Curated OER
Ratio, Rates and Percentages
In this ratio, rates and percentages worksheet, 8th graders solve 22 various types of problems related to ratios, rates and percentages. They first write ratios in lowest terms and describe each of comparison stated. Students also solve...
Curated OER
Decimals and Percents
For this decimals and percents worksheet, 8th graders solve 26 different types of problems that include expressing numbers as a decimal and a percent. Then they change each number to fractions and determine the unknown number for each...
Math Mammoth
Mental Math in Percent Problems
In this math worksheet, students are given 21 percentage problems which they are to work out mentally. There are story problems, tables and simple conversion.
Math Mammoth
Percent Fact Sheet
In this math activity, students are given 9 percentage problems that involve conversion, variables, story problems and fractions.
Math Mammoth
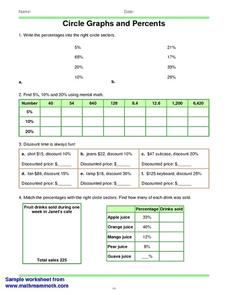
Circles Graphs and Percents
In this percent instructional activity, students read and interpret circle graphs. They determine discounts, and match percentages with circle sectors. This one-page instructional activity contains approximately 30 problems.
Curated OER
Car Activities
In this math worksheet, students find cars in Auto Trader. They find the difference between the prices of the cheapest and most expensive cars. Students select a car they like and follow directions to buy on credit. Students complete a...
Curated OER
Percentages
Students examine the concept of percent and calculate percentages of one hundred and convert them into fractions and decimals. They view and discuss a one hundred square grid and identify percentages. Students design a playground...
Curated OER
Smaller Than One
Sixth graders practice converting a fraction into a decimal and a percent. They explain relationships among rational numbers. They order and compare whole numbers, fractions (including mixed numbers), and decimals using a variety of...
Curated OER
Jambalaya's Restaurant
Young scholars use a menu and recipes to work on adding, subtracting, and percentages. They are given they weekly circulators, advertisements, or actual products and students practice figuring out sales tax. Young scholars figure slaes...
Curated OER
Science Fair Space
Students determine the most equitable way to share space and cost between three schools for a fictional science fair. Given a diagram, a word problem, and a data set, students analyze and explain the best way for all schools to share...
Curated OER
Count The Letters
Students perform activities involving ratios, proportions and percents. Given a newspaper article, groups of students count the number of letters in a given area. They use calculators and data collected to construct a pie chart and bar...
Curated OER
Peter Rabbit Meets Charles Darwin
Students start to think of evolution in terms of populations. The class follows a cartoon scenario of a rabbit population in which there is selection and change of gene frequency. They receive copies of the scenario or the whole thing...
Curated OER
The Discount Is Right
Students estimate and calculate the sale price of five items using the original price and a designated rate of discount. They use percent to calculate the rate of discount and the original.
Curated OER
Making the Connections
Use a Horton Chart to identify relationships between numbers and make equivalent fractions and decimals. Scholars change a fraction to find the greatest common factor, find percents, and make equivalent decimals.
Curated OER
What Are the Odds?
Middle schoolers identify and interpret various ways of expressing probability as a decimal, fraction, percent, or ratio. They solve problems based on probability as they apply to real world applications.
Curated OER
Froot Loops to the Max - 3
Learners complete and solve five questions/problems related to a box of Froot Loops cereal. First, they determine how many of each color of Froot Loops are in the box. Then, pupils determine which color had the greatest frequency and...
Curated OER
Dried Meat
Students investigate the traditional method of drying meat used by Native Americans. They apply math concepts such as ratio, proportion, percent, and scientific notation to determine the amount of meat the is dried from an animal using...


