Curated OER
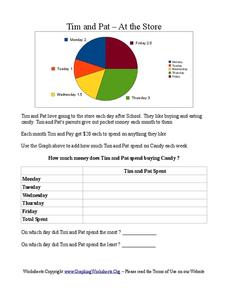
Tim and Pat - At the Store
In this pie chart worksheet, students use the pie chart to add the amount of time Tim and Pat spend buying candy each day of the week. Students answer 2 questions about the table.
Curated OER
Jim, Tony, and Frank - The School Fundraiser
In this bar graph worksheet, students use the horizontal bar graph to count how much money each student collected for their fundraiser. Students answer 10 questions.
Curated OER
The Bread Shop
In this bar graphs worksheet, students study the bar graph to count the money Adam made during each day. Students answer 10 questions.
Curated OER
Cindy and Linda - Selling Lemonade
In this pie charts worksheet, learners use the pie chart to count how many glasses of Lemonade were sold by Cindy and Linda. Students complete the table and answer 3 questions.
Curated OER
Tim and Pat - At the Store
In this bar graphs worksheet, students use the bar graph to add how much time Tim and Pat spend buying candy each week. Students complete the table and answer 3 questions.
Curated OER
Jim, Tony and Frank - The School Fundraiser
In this bar graphs instructional activity, students use the bar graph to count how much money students collected during a weekend fundraiser. Students answer 10 questions.
Curated OER
Pictograph Activity
In this pictograph worksheet, learners learn to read a pictograph and answer questions based on the data. Students then draw two of their own pictographs using the given information and answer questions based on graphs.
Curated OER
Student Graph for the Mixed-Up Chameleon
In these graphing worksheets, students ask their classmates which animal they would like to be. Students then tally their numbers and graph the data.


