Curated OER
Graphing Worksheet: Favorite Sports
In this graphing worksheet, students analyze a bar graph in which favorite sports are displayed. Students answer 8 questions about the graph. Note: The bars in the graph are shaded in different colors.
Curated OER
Census Statistics and Graphing
Learners graphically represent data from the Census. In this middle school mathematics lesson, students investigate the housing characteristics of different tribes of Native Americans and compare them to the average American...
Curated OER
Graphs
Students investigate circle and bar graphs. In this middle school mathematics instructional activity, students determine which kind of graph is suitable for a given situation and create circle and bar graphs.
Curated OER
Introduction to Graphs: Bar Graphs, Line Graphs, Circle Graphs
In this graphing data worksheet, students answer 5 short answer questions about graphs. Students determine which type of graph best represents various data sets.
Curated OER
Graph a Panther's Diet
Students examine the diet of panthers. In this interpreting data lesson plan, students collect data on the panther's diet and chart the data in bar and pie graphs.
Curated OER
Bar Graphs
In this bar graph activity, students complete math problems having to do with different bar graphs. Students complete 10 problems for 10 different graphs.
Curated OER
Mean, Mode and Bar Graphs
In this mean, mode and bar graphs worksheet, 5th graders analyze the data given, then answer three questions about a bar graph and the data shown.
Curated OER
Transportation Math
Students explore the concept of exponents. In this exponents lesson, students evaluate various bases to powers. The bases to a given power are in the context of miles driven, stops on a route, and minutes spent in route. Students read...
Curated OER
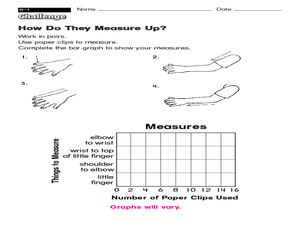
How Do They Measure Up? Measure and Graph
In this measure and graph worksheet, students use paper clips to measure various lengths shown, then bar graph their results, a total of 4 measurements.
Curated OER
Use a Bar Graph
In this bar graph worksheet, students use a given bar graph to answer a set of 3 questions. Answers included on page 2.A reference web site is given for additional activities.
Curated OER
Graph Groups
In this graphing worksheet, 3rd graders create their own bar graphs. students study the pictures shown and complete 5 graphs beside each picture.
Curated OER
Use Information in Line, Bar, Circle, and Picture Graphs to Make Comparisons and Predictions
Eighth graders explore the concept of graphs. In this graphs lesson, 8th graders compare and contrast picture graphs, bar graphs, line graphs, and circle graphs. Students examine each type of graph and answer questions and make...
Curated OER
Temperature
Students explore the concept of temperature. In this temperature instructional activity, students read thermometers in degrees Celsius. Students discuss the temperature of the seasons and what clothing they might wear given a certain...
Alabama Learning Exchange
What's Your Favorite Chocolate Bar?
Students complete a math survey. In this math graphs lesson, students complete a survey about their favorite candy bars. Students create different kinds of graphs using Microsoft Excel to show their results.
Curated OER
Learning to Make Bar Graphs
Students construct bar graphs using the results from various experiments. In this graphing lesson, students review data from a previous experiment and demonstrate how to construct a bar graph. Students use a checklist to ensure...
Curated OER
Bar Graph- Calories In Fast Food Items
In this bar graph worksheet, students analyze a bar graph that shows calories in 10 fast food menu items. Students answer 7 questions about the graph.
Curated OER
Favorite And Least Favorite Vegetable Survey and Bar Graph
In this favorite and least favorite vegetable survey, learners create a bar graph after they survey and keep track of data on this graphic organizer.
Curated OER
Professor Panda's Pizza Graph
In this data analysis worksheet, students answer 11 questions using a bar graph that was constructed from the answers to a survey about pizza toppings. They use a secret code to determine the best place to have a pizza.
Curated OER
Double Bar Graphs
In this double bar graphs practice activity, students sharpen their problem solving skills as they solve 6 story problems.
Curated OER
Read a Bar Graph
In this bar graph worksheet, students use a bar graph of favorite zoo animals to solve 6 simple word problems. Houghton Mifflin text is referenced.
Curated OER
Problem Solving: Use a Graph: Problem Solving
In this bar graph worksheet, students read the word problem and use the bar graph to complete the problem solving questions for understand, plan, solve, and look back.
Curated OER
Match Game: Enrichment
In this solid figures worksheet, students choose a shape from the box that fits the bar graph totals for the faces, edges, and vertices. Students then complete the last bar graph using the one unused shape.
Curated OER
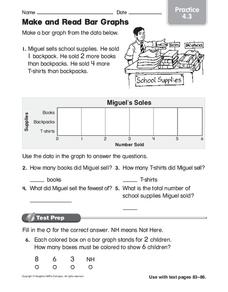
Make and Read Bar Graphs
In this bar graphs worksheet, students make a bar graph about the sale of school supplies with the data presented in one story problem.
Curated OER
Frequency Tables and Histograms
In this graph activity, 5th graders study the data presented on a bar graph. Students then respond to 4 short answer questions using the information that has been provided.


